Products such as Tableau, Qlik or also Power BI from Microsoft are used in the Data analysis and Data visualization frequently used. A very important topic here is the Quality assurance. Because there is hardly anything worse than when the data shown does not correspond to reality. Automated quality assurance in IT projects is already widespread, but this is still far from being the case in visualization and data analytics projects. The result: after every change manually checked whether all data is still correct and whether the Comprehensibility of the dashboards is still given. In order to automate this complex process, there are various Tools with a wide range of functions. However, some of these tools are only applicable to one product - only a few providers cover Tableau, Qlik and Power BI. But what exactly are the functions of the different tools? We have taken a closer look at four of the available tools.
Four data analytics tools with different test functions
We tested these four tools BI Validator, Power Tools, Kinesis and QuerySurge to the teeth. While the tools differ significantly in terms of many functions, they have one thing in common: they can all be used to Performance of reports be tested. But let's take a closer look.
Read part 1 of the Data Analytics series here: Is it still possible to define the term?
BI Validator
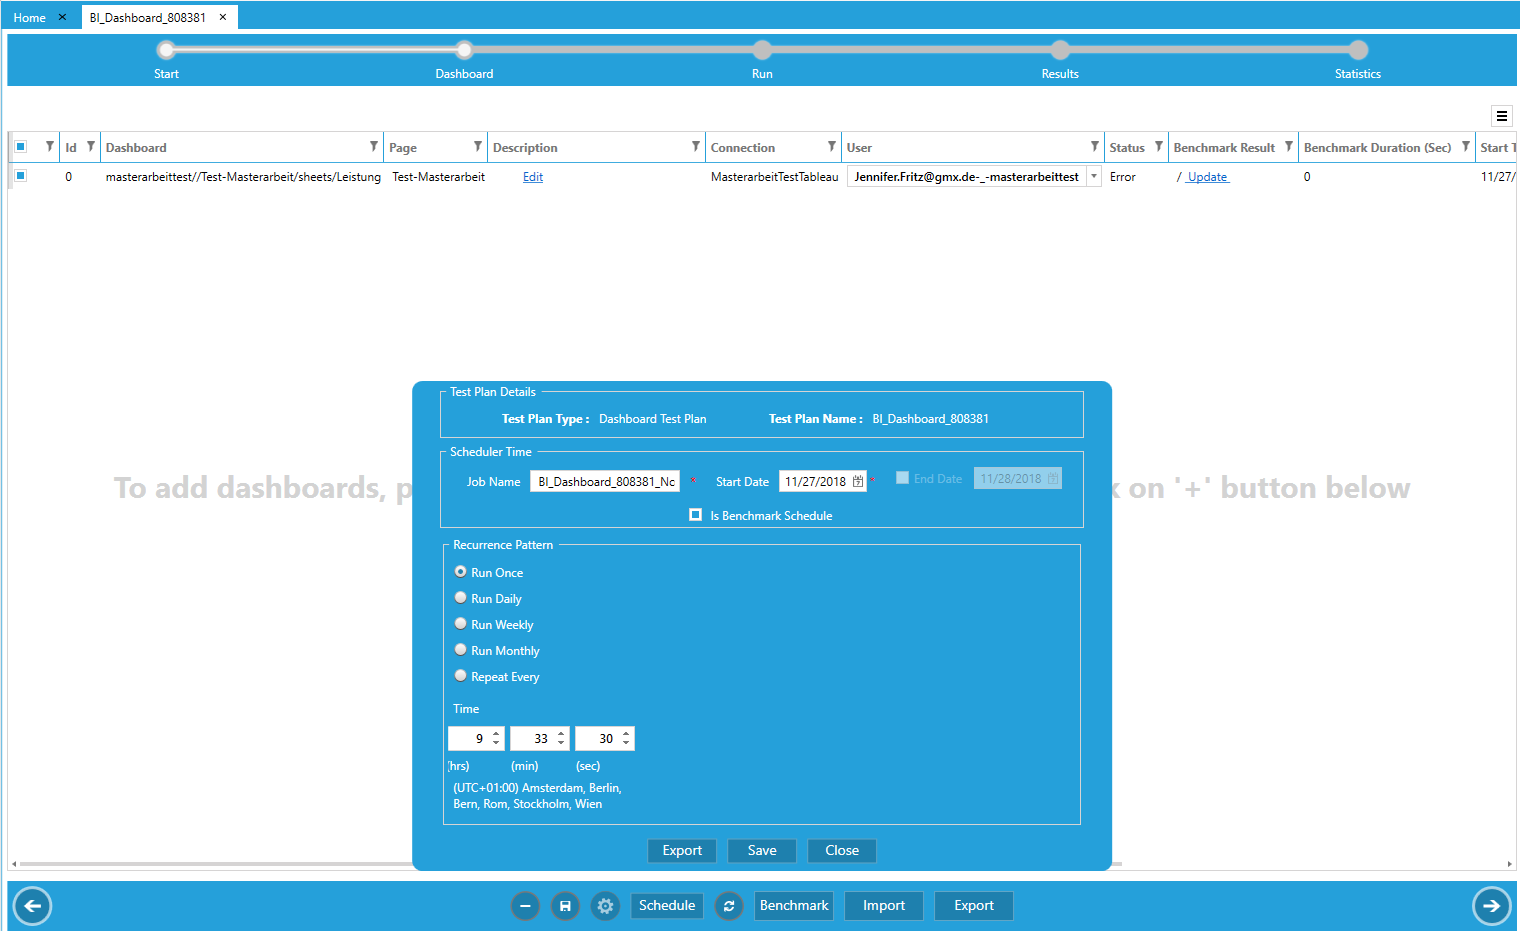
The BI Validator for example, offers various tests:
- Regression test of workbooksComparison of workbooks for the identification of data and layout differences
- Regression test of viewsComparison of different views to recognize visual as well as data differences
- Stress test: Acquisition of performance statistics by simulating the user load
- Upgrade testComparison of workbooks before and after the upgrade
- Performance Test: Monitoring of dashboards, creation of performance reports of the production environment
- Function test: allows you to assign and compare report data to data sources in order to check views
- Migration test: Comparison of the data of a report generated by Tableau
- Safety test: Comparison of the access levels of the individual users or groups
- Corporate cooperation: Results can be shared or sent by email as test plans can be stored in the company repository.
Our conclusion: The BI Validator is clear and easy to use (even without programming knowledge), so the Intuitive tests can be carried out. There are two possible applications for the test runs: manual or automated.
Power Tools Desktop
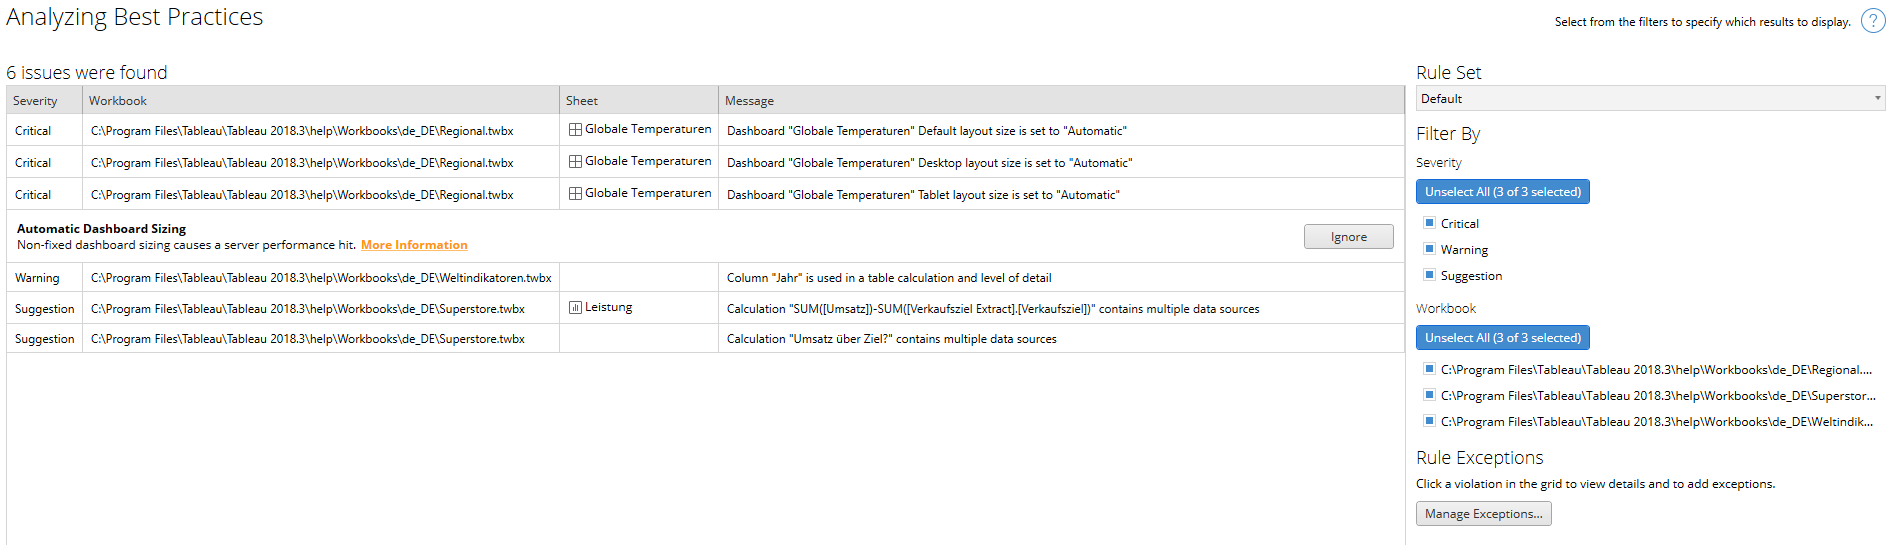
To take a closer look at the functions of Power Tools, we have focused on Power Tools Desktop (PTD) concentrated. With this it is possible to Overview of all data fields when checking data sources, also with a note on how many views and calculations they appear in. If you want to take a closer look at the data fields, it is possible to use the Views and Calculations directly or export it as an Excel file or PDF. Another useful function to get an overview of all data records, fields or data types is the output of a general Statistics on data sources of individual workbooks. In addition, the Style Manger to capture individual formatting of the workbooks and merge dashboards.
Our conclusion: The focus of Power Tools Desktop is clearly on checking the performance of workbooks and documenting data. The graphical user interface enables Simple navigation and the execution of analyses. However, the tests are exclusively manual possible.
Kinesis
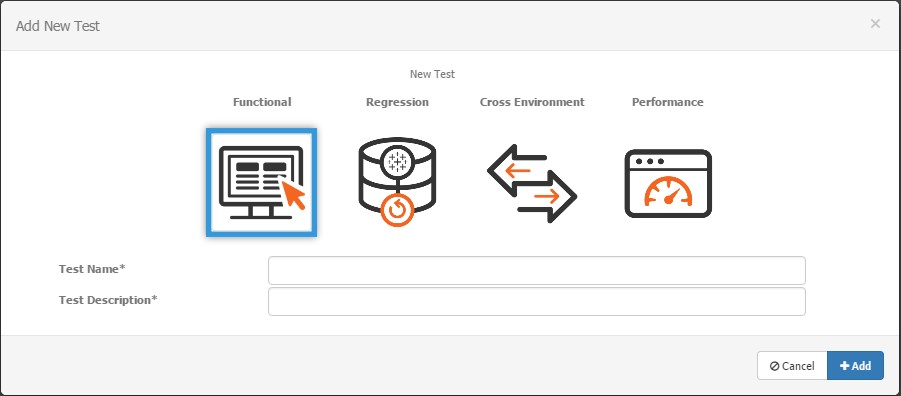
How does Kinesis fare with a slim four test?
- Function testAmong other things, it is possible to simulate user interactions and user decisions and to write test cases
- Regression testComparison of two tableau views and tracking of changes
- Cross-environment testComparison of views in different environments (e.g. locations or servers)
- Performance testEvaluation of server performance, e.g. response times
Our conclusion: Although the user interface of Kinesis is very simple, there are some uncertainties here and there, as various messages are initially displayed in an incomprehensible way - as a Assistance is urgently the Documentation required.
QuerySurge
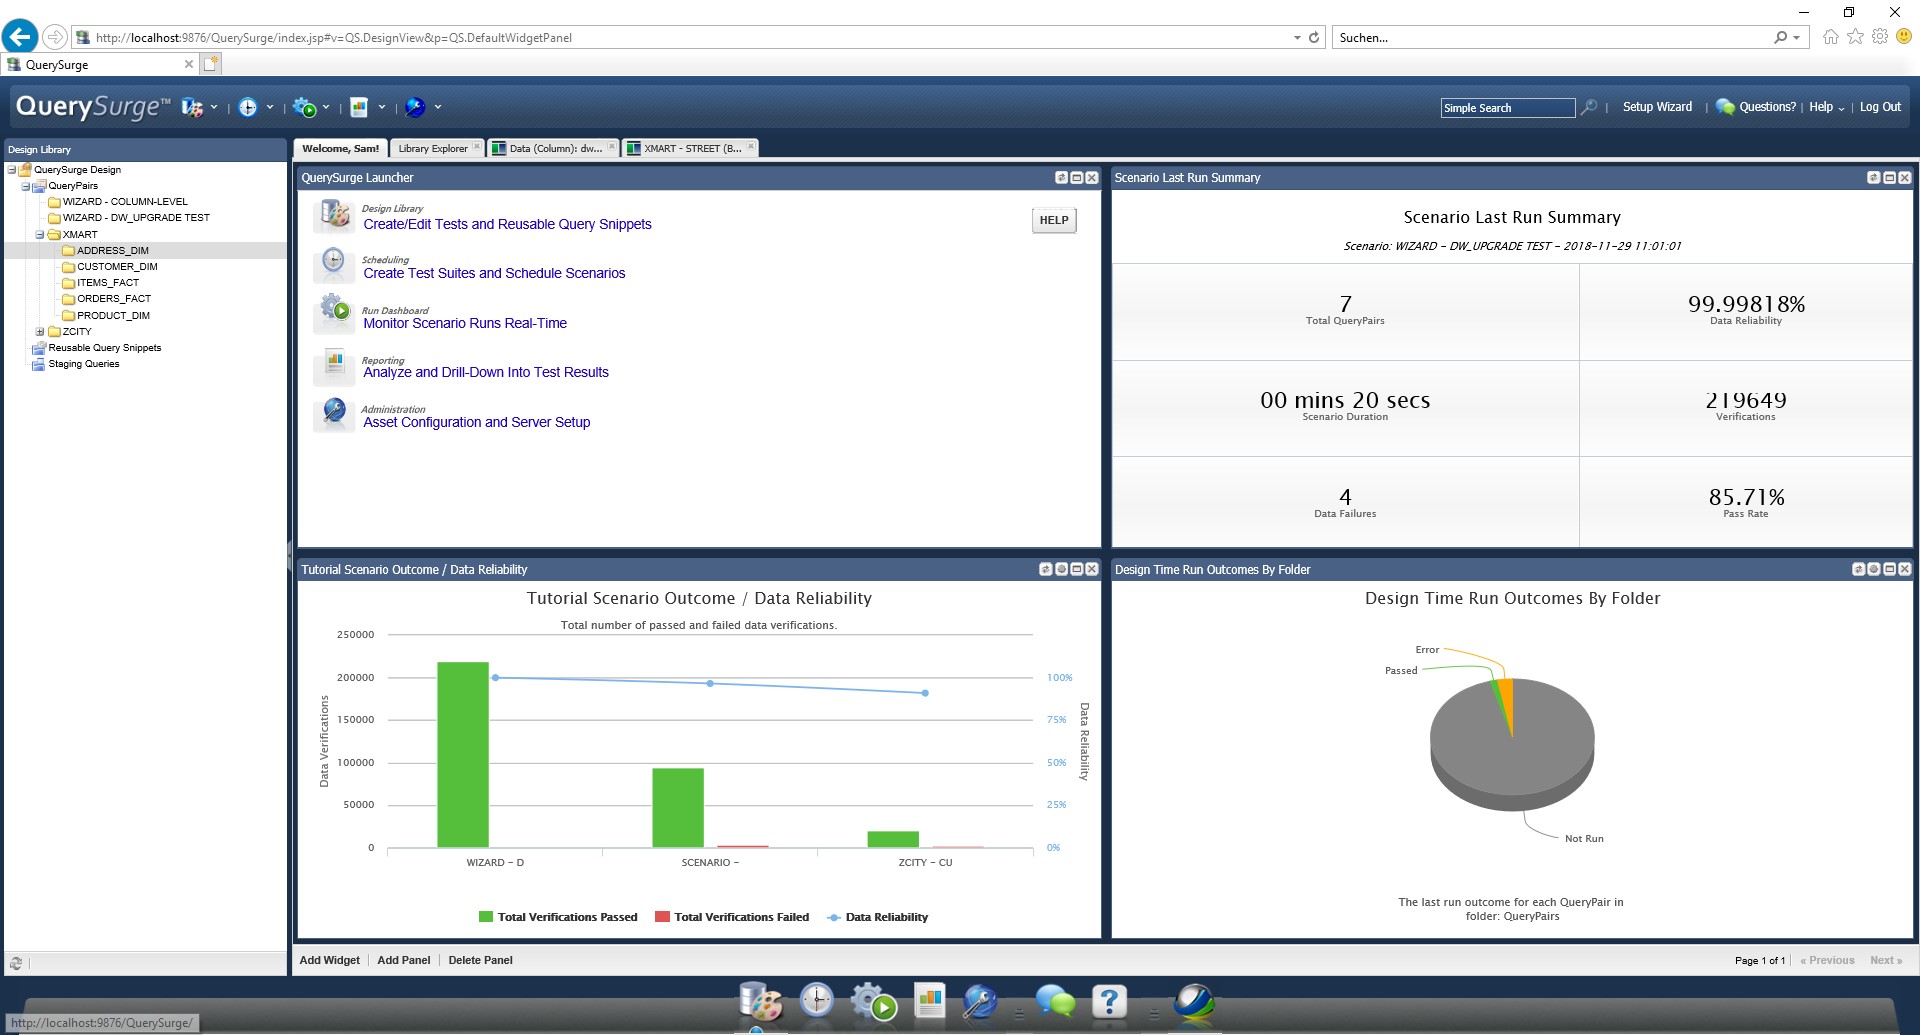
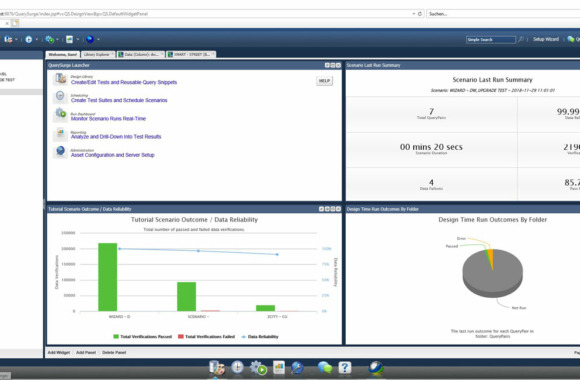
Last but not least, we take a closer look at QuerySurge. This is accessed via Internet Explorer - so more users possible. The Navigation works via a graphical user interface. The test data is evaluated in the form of Pareto diagrams and Correlation diagrams. Information messages (e.g. Error messages) are conveniently displayed directly on the screen. The output of individual reports or error collection lists is possible via Excel, CSV or XML. With the BI Tester Add-On a wide range of areas are also covered:
- Business validation from reports
- Complete Regression test the BI data
- Migration test from one BI provider to another
- Updating tests from one version to the other
- Comparison of reports between Servers
- Transfer of parameters to a report
- Queries from Report metadata
Our conclusion: With QuerySurge, is the Usability a little difficult at first, it becomes naturally after repeated use. However, various tutorials are very helpful. A must-have for using the tool: Programming knowledge.
Fancy a little story? The top 3 business intelligence tools - a short story
Conclusion
The Automation of quality assurance in the area of data analysis and data visualization has many positive aspects - but implementing it with the right tools is just as important for it to work. This makes it all the more important to support employees in the Verification of data to support them by giving them the suitable tool to the hand. Of course, every tool has its strengths and weaknesses. In order to find the right tool for your own purposes, it is therefore important to have clear Requirements to the tool. This is the only way to find the right provider. Our Favorite is the tool Query Surge: Although there are SQL knowledge necessary, but once you get behind the logic of the tool, you quickly understand the Functionality. In addition, the developers are currently in the process of developing the tool for Microsoft Power BI and Qlik compatible.
Find out more about our Data Driven Services
Sources:
Gudivada, Venkat N. (2017): DATA ANALYTICS: FUNDAMENTALS. In: Mashrur Chowdhury, Amy Apon and Kakan Dey (eds.): Data Analytics for Intelligent Transportation Systems. Netherlands, United Kingdom, USA: Elsevier, pp. 44-80.