We explain the Read, Transform and Write steps that are necessary to prepare data so that it can be used for specific applications. Particular attention is paid to the transformation of data and the importance of correct linking and formatting.

Data analysis procedure
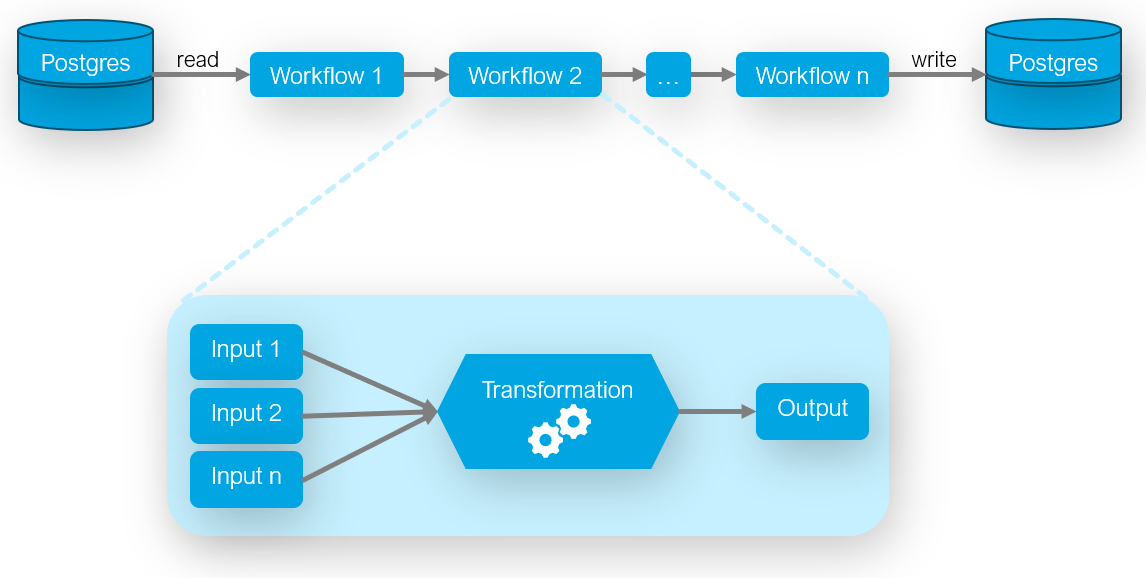
In general, the procedure can be divided into the following steps Read, Transform and Write divide.
Read
In this step, the data is loaded from the store (e.g. data warehouse) or a previous workflow. If required, additional data can be added from various sources within the individual workflows. For example, if a mapping table is required that was created by colleagues in Excel.
Transform
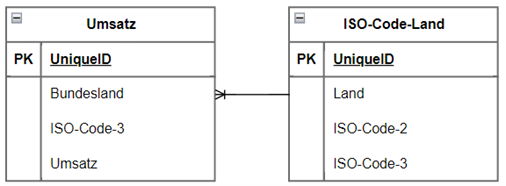
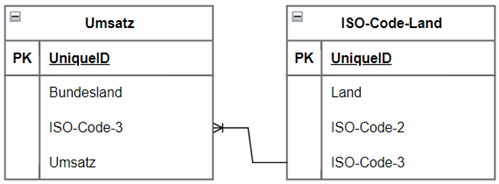
All data sources required for the use case are then merged in the transformation. It is important to ensure that the data is mapped using meaningful keys.
Positive
Negative
It is also important to pay attention to how the data is "linked" with each other. This also depends on which tool is used to prepare the data. With Tableau, data can be linked via Join (inner, right, left, full), Relationship, Blend or Union. Each of the individual "connections" has a different effect on the data.
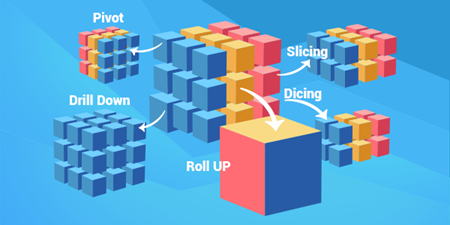
Further operations such as Group By or Pivot can then be applied to the data.
Additional columns that are relevant to the use case can also be calculated.
Write
There are two use cases for dealing with the data. Either the prepared data is treated as an intermediate result and used in a subsequent workflow, or the data is prepared and can be stored in the desired format or saved in a database for subsequent use in the use case.
Conclusion
Data integration laid the foundation for a deep understanding and the ability to act in a data-driven manner. The second step was to pour the data into a format in order to make it usable for the use case.
In the final step, the use case can be visualized with the processed data. More on this in the next article.