This is exactly where doubleSlash stood: on the threshold of a confusing data chaos that threatened our efficiency. But instead of drowning in the flood of data, we decided to turn things around. With a mix of data mesh principles, rigorous data management and a healthy dose of innovation, we embarked on a fundamental transformation. Find out how we transformed our corporate reporting from a cumbersome relic into a dynamic, error-resistant data highway that not only minimizes troubleshooting but also makes data-driven decisions more reliable.
Our success over the years is reflected in the fact that more and more questions, which we refer to as use cases, have been added. In this context, new data sources were integrated and data was processed and visualized. The resulting data architecture can be described as "historically grown" and lacked clarity over time. Intermediate results of data preparation were used for other use cases, built upon each other and developed in parallel with similar logic and identical data. As a result, we had to deal with more and more errors, which we corrected in one processing route, but overlooked similar errors in other transformations. This led to inconsistencies and, above all, to a lot of time being spent searching for and correcting errors instead of creating new analyses.
The approach was also very heterogeneous. Occasionally, "all" data was taken from a source system and processed further on a large scale. In other places, however, we consistently used only the data actually required from the source system.

In short, it was time for the big clean-up.
Given our knowledge of Data Mesh and other concepts as well as our experience from various customer projects, we "only" had to start the implementation for our own data hub. As with our customers, change causes pain. This is mainly due to the fact that historically grown systems have their pitfalls and we have to deliver new use cases as well as continue to operate existing ones. We had to experience all of this. However, we were certain at all times that changes were necessary, because without them, the time and effort spent on troubleshooting and correcting errors would steadily increase and reliability would decrease.
Procedure according to professional affiliation
First, we organized our use cases and KPIs according to specialist domains and scheduled meetings with the relevant stakeholders. The most important source systems are also located in the area of finance, the domain of our corporate reporting with the greatest scope and the most use cases.
Together with the departmental experts, we categorized the KPIs from the use cases into a functional hierarchy and identified dependencies. We also determined which KPIs needed to be developed from a business perspective from specific data or input KPIs, as the "truth" is often anchored in specific source systems.
Here, for example, it became clear that we did not have the one truth about employees, their weekly working hours, employment relationship and team affiliation. Therefore, the first and sustainably important step was to build such a table, which was to be integrated into various use cases and data products. Although the initial effort was high, the benefits soon became apparent, especially in the simplified troubleshooting of financial use cases based on the employment relationship or team affiliation of employees.
Hierarchical classification
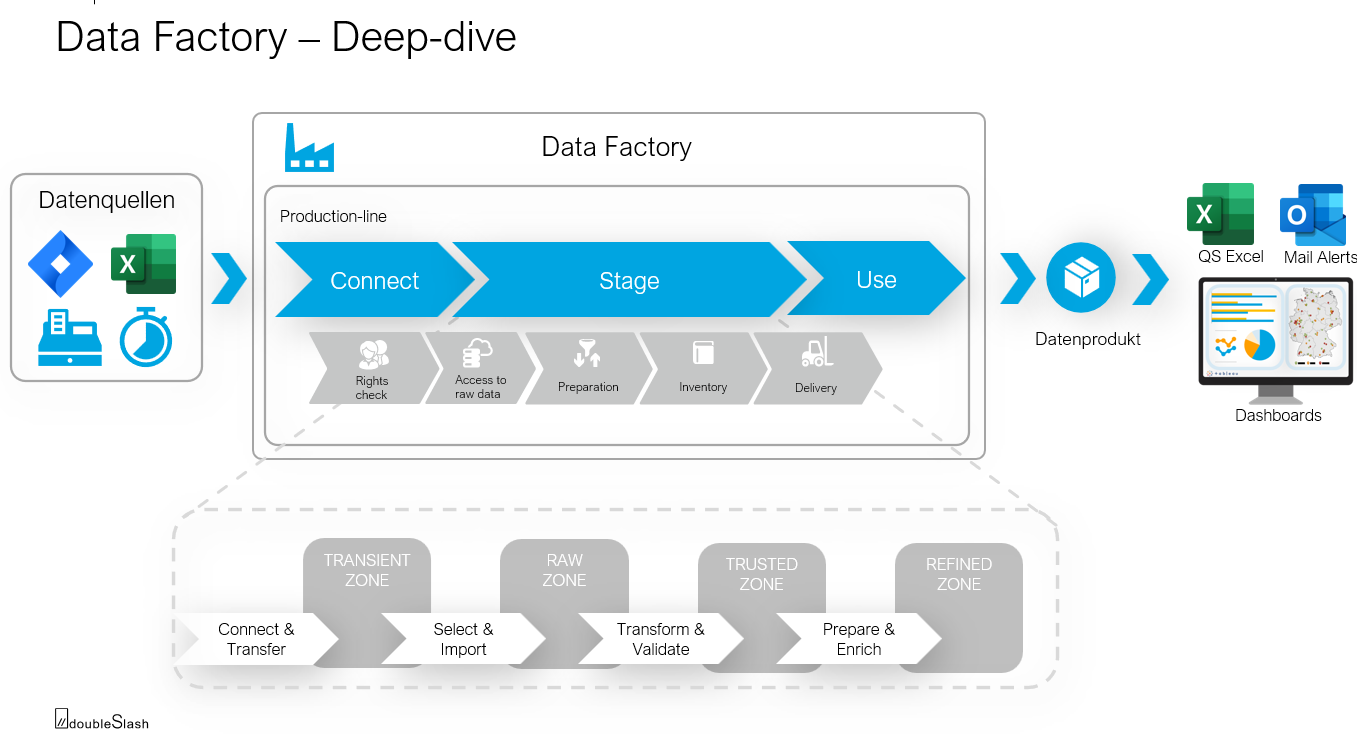
In particular, the hierarchical view of the KPIs allowed us to design the functional data architecture. The basic concept was the Data Factory (https://www.doubleslash.de/leistungen/data-factory/ ) together with the idea of data products (https://staging.blog.doubleslash.de/usability-von-datenprodukten-tipps-und-best-practices-aus-dem-projektalltag).
Based on the knowledge gained from previous data preparation, we held further meetings with departmental experts to design the use cases and data products in such a way that they cover all relevant questions and the preparations build on each other logically. Some existing processing routes were thoroughly revised and virtually rebuilt. Others could be adopted with little effort or segmented into several, technically separate, successive data products.
A use case is always a preparation that produces an output that is either visualized or provided to the requester as a file.
In contrast, data products are technically delimited data preparations which, unlike use cases, are not delivered directly to the requester but are integrated into other use cases or other data products. Base tables, which contain cleansed and prepared data from the source systems, serve as input for data products and use cases. These base tables are historicized so that the KPIs can be recalculated for a day x independently of the source systems. As the base tables are usually homogeneous with regard to the source systems, they also function as a technically formulated data requirement for the source systems.
Lifecycle of a use case
Whenever data from one use case is later required in a similar way in another use case, a more general data product should be developed from the original preparation, which is then filtered and further processed as required in both use cases. In this way, we avoid having to prepare the data again in parallel. This further development occurs in particular when preparing data from "new" source systems for the first time.
Experience
For our data hub, a great deal of capacity was invested in restructuring the functional data architecture. As a result, we can state the following:
- The data requirements in the direction of source systems are now clearer in technical terms. Accordingly, the necessary adjustments for a potential exchange of source systems can be specified more clearly.
- When consolidating the data paths, it is important to always remember to consistently adhere to the previously established rules. In our case, for example, this meant avoiding the parallel processing of similar data products or use cases. And yet, in the end, it is hardly possible to act consistently to 100%.
- The structuring of the various preparations now has a much stronger technical focus. For new use cases, we can discuss the use of the various data products directly with the stakeholders. If the finance manager talks about "expenses by cost type", we now know immediately which data product is meant and must be used to answer the question.
- The clear assignment of responsibilities enables better integration of the specialist knowledge of the data owners and the associated processes. The documentation we created for the base tables, data products and use cases significantly improves the transparency of the preparations and enables questions to be clarified quickly. The historicized base tables help in various situations to be able to recalculate the data status of a KPI on day X
Our assessment
Despite the high costs and occasional challenges posed by complex technical logic, we are very satisfied with the new data architecture. However, we can improve further in the more consistent handling of master data management. We need to obtain master data (e.g. personnel, customers, accounts) more consistently from the source systems, which are regarded as a reliable source for the specialist contacts. We are also aiming to improve data quality, for example by identifying and correcting maintenance errors when they are imported from the source systems. We are also planning to improve the testing of data sections in order to address errors in preparation more effectively. We are developing an automated data lineage to increase the transparency of the base tables, data products and use cases that build on each other. This should enable us to track the path of specific data through our data hub more precisely, minimize errors and enable the specialist departments to make well-founded, data-based decisions.