We also expected new perspectives on the existing data to make it easier to check whether cross-departmental goals have been achieved. What experiences have we had with our customer projects and with our own data project?
More efficiency - more data preparation...
Some aspects have already been referred to in the last few articles.
- Part 1: Expectations and triggers to the article
- Part 2: Technical requirements and structure to the article
- Part 3: Technology decision to the article
- Part 4: Consolidation and stabilization to the article
A Daily updated reporting "at the touch of a button" now exists for a wide range of issues. We have added HR, sales, marketing, IT and, in a current expansion stage, all employees to the originally planned stakeholder groups of management and team leaders alone. The latter in particular could provide an additional boost in the direction of new questions give. The Self-service We have not yet implemented the creation of the Data preparation and visualization is in the hands of the experts. In view of the size of our company and the issues we have faced to date, we have still refrained from using big data technologies. The effort and bottlenecks have fallen dramatically - for employees who previously had to fill in manual reports. However, the Development of a data landscape with all its specialist and technical activities is initially much more time-consuming and only pays off after some time. The analogy with the iceberg can always be used when distributing the effort: Only a fraction of the effort is visible to the user, most of it takes place in the data connection and preparation.
Knowing data better means being able to use it better
We have our Get to know data better can. The ability to identify various influencing factors without major effort has enabled us to develop additional key figures. This makes it easier for us to find the important levers for improved target achievement. A big advantage: Through appropriate Data preparation we can analyze at various aggregation levels. Each area or subject area now finally has a targeted overview of its own target achievement.
In the contribution to the technical structure of the questions It has already been mentioned that there are cross-departmental targets that were previously difficult to check. This is now much easier because the data from the respective departments can be combined. The customer journey that sales and marketing analyze can serve as an example. This involves the contact points of leads and customers with our company. This requires a large number of data sources from different areas of responsibility, which can now be better combined. This has resulted in new perspectives on the data. It also became apparent that certain key figures are not as meaningful as hoped and had to be replaced or expanded. The better we know our data and the factors influencing our KPIs, the greater the reliability the data-driven decisions based on them.
What data can we use to show the past and the current situation and, in a second step, find an explanation or indicators that explain both? These are the questions that need to be clarified first and have already been answered several times in our data project. This can never be completed, because New conditions may make new key figures necessary. It is important that professional questions are always asked and that distortions in the data become visible.
The future of the data hub: more transparency and (even) more insights
The database that has been created over the years can be used for future questions, so that the effort required to connect and prepare the data is increasingly paying off. Based on the existing knowledge of the data, key figures are now calculated that can be used as Indicators for later development apply. One wish is to focus even more strongly on Data-driven decisions and concrete measures. This requires knowledge of the chain of effects, which takes time.
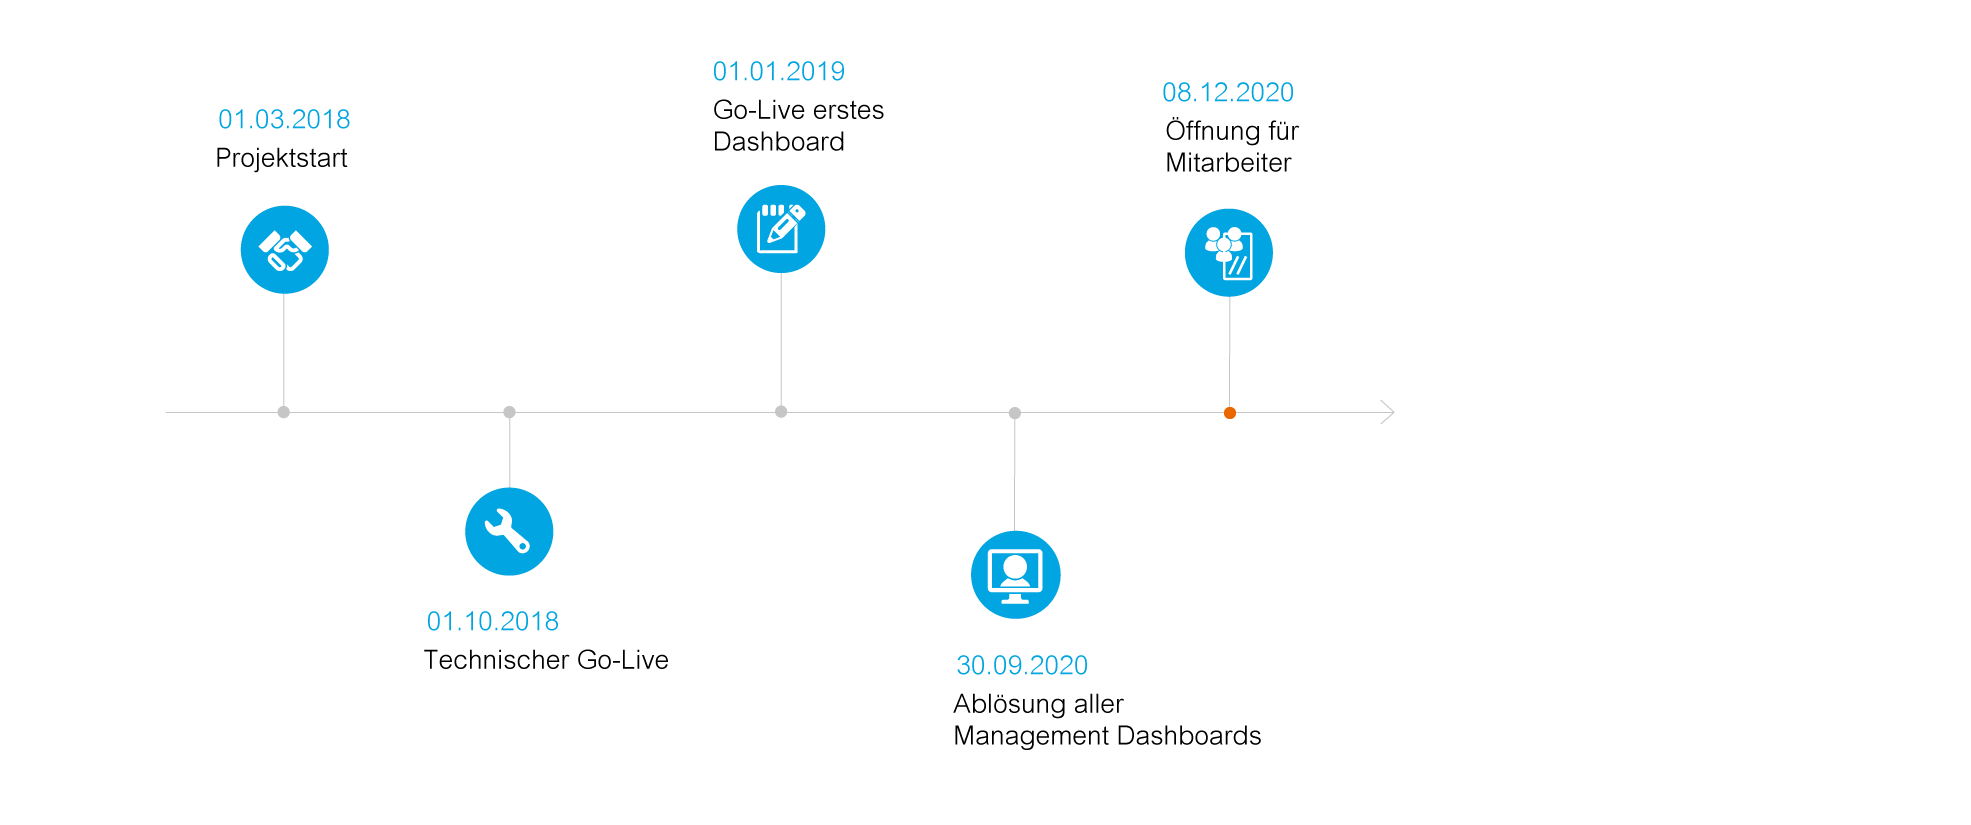
In future, the provision of analyses for all employees in particular will enable unprecedented transparency in the company. And many eyes may also see many new aspects and correlations that can then be examined in further analyses.
Trends in visualization such as Storytelling with data can be of particular interest in processes such as the customer journey or in HR marketing. This better thematic embedding of the interrelationships allows relationships with (potential) customers and (potential) employees to be rethought.
Our journey with the data in and around our company will continue. The steps we have taken so far were necessary and form the basis for everything else we want to do with this treasure trove of data in the data hub - not least in line with our Strategy of the digital company.
Sources: