Dashboards are an indispensable tool for gaining informative insights from the abundance of data and enable us to make data-driven decisions.
In this article, we will first focus on the cornerstone of dashboards: data integration. Because in the complex world of data analysis, dashboards are just the visible tip of the iceberg, while data integration and transformation are the supporting pillars underneath.

Data-driven decision-making
The turnover of a medical technology provider is to be examined as a practical use case. This raises a number of questions:
- How have sales developed?
- How did things go compared to the previous year?
- How are sales made up?
- How much turnover did customer group X generate in month Y?
- What connections are there between customer groups and products?
Below we present a sample dashboard that conceptually shows how dashboards can be used to extract information from complex sales data.
Revenue by customer
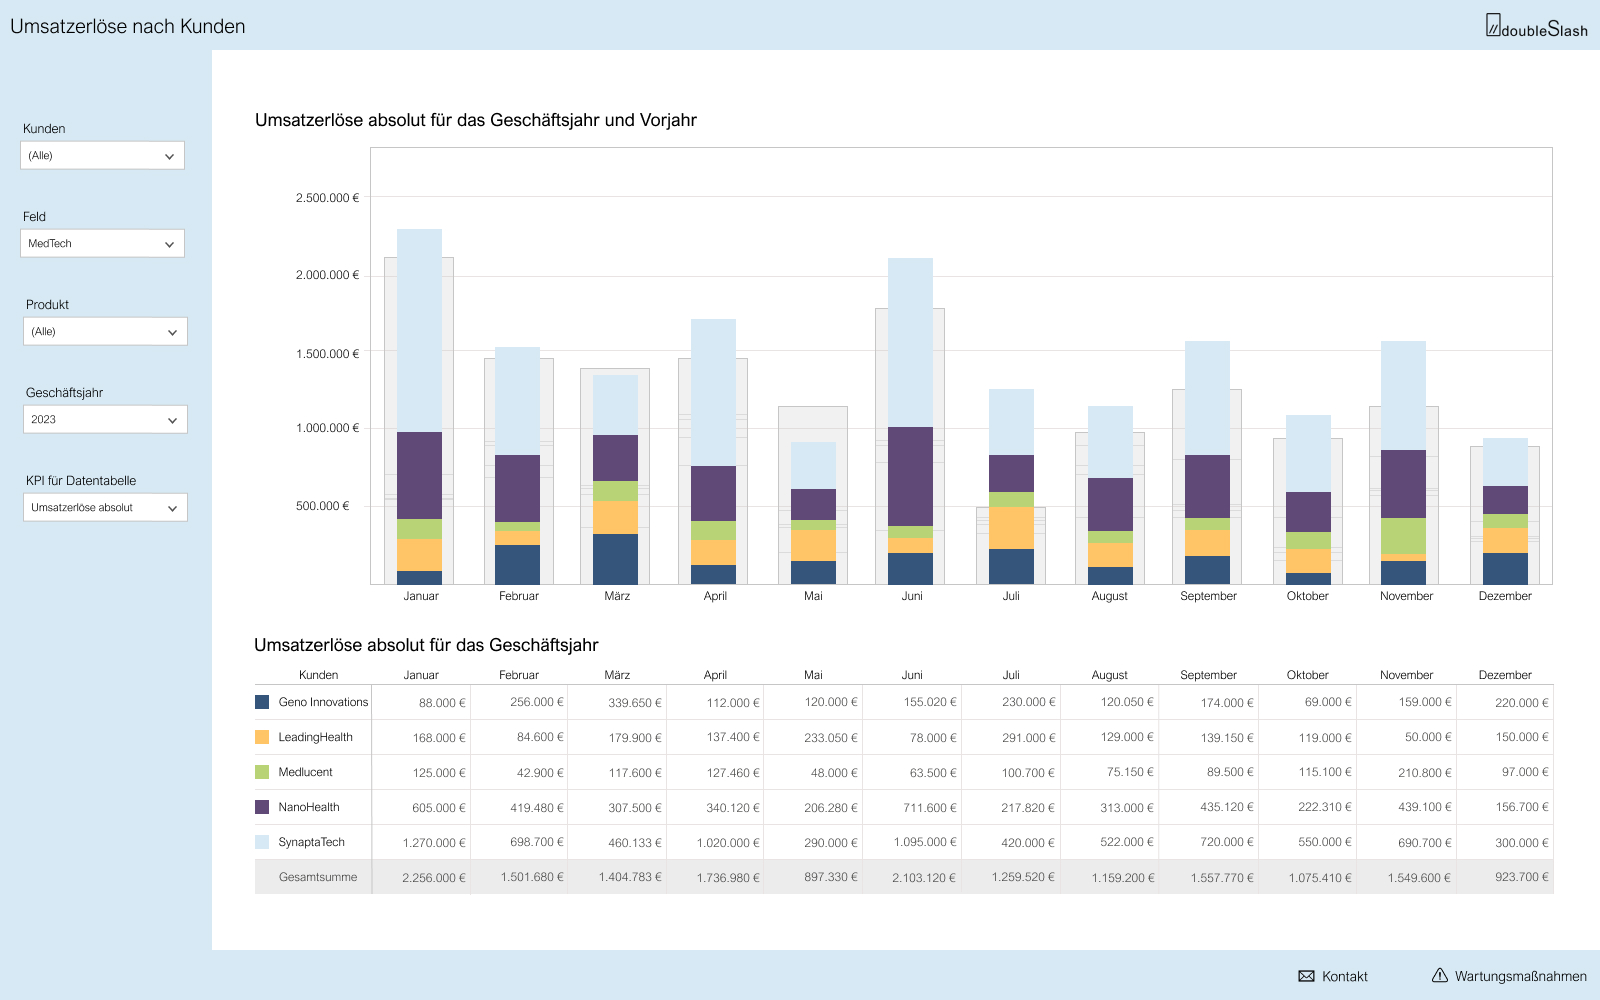
- Holistic understanding of sales development through the stacked bar chart
- Simultaneous comparison with previous year's figures using the gray columns
- Sales split by color separation of customers
- Detailed insight into the sales figures through the table
- Trend recognition through clear high and low points
- Filter options for a detailed analysis (sales by customer, product/service, financial year and key figure)
Revenue by product/service
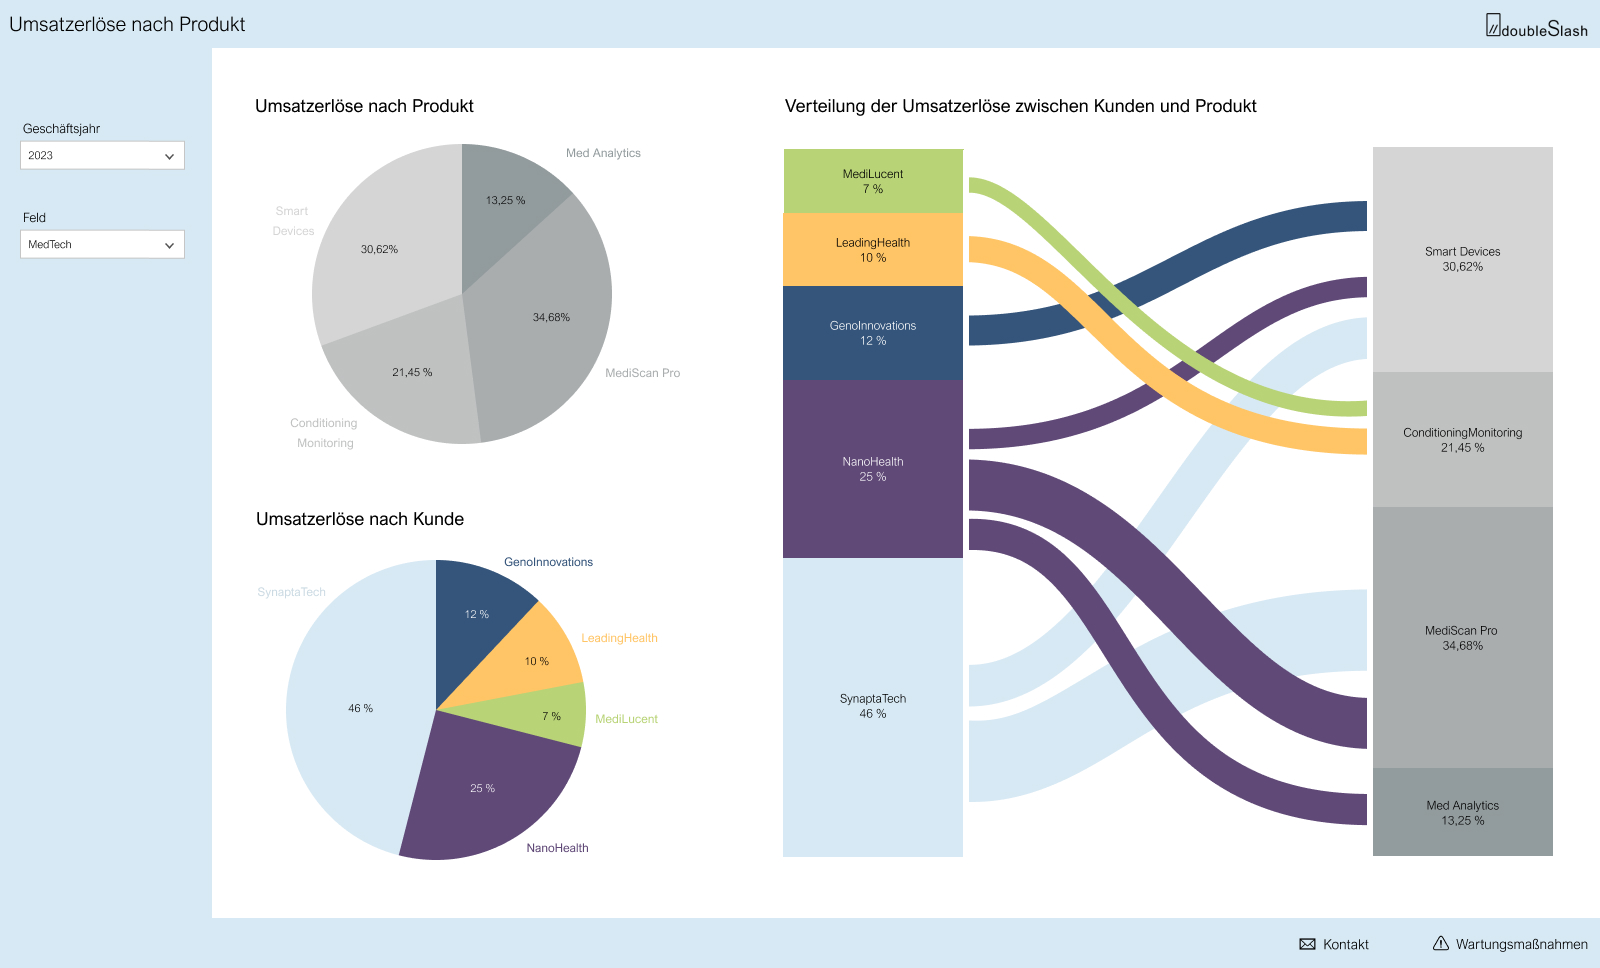
- Percentage share of customers and products/services easily recognizable through the pie chart
- Connection between customer and product/service:
- The Sankey diagram creates a visual link between the customer groups and the products/services
- The linked dimensions can be used to track which products/services the customers were interested in
Data integration
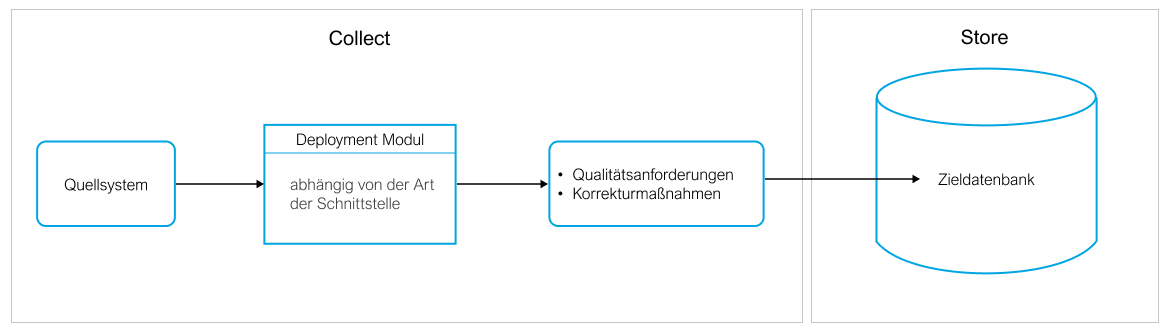
Before in-depth data analysis is possible, the relevant data must be collected. The aim of data integration is to convert both structured and unstructured data sets into a consistent data set. An exemplary data collection process is outlined below, although this may vary depending on the specific requirements.
Collect
The first step in the integration process is to identify the source systems and their associated interfaces. This enables accurate extraction of the data, which is usually done through direct queries, API interfaces and data exports. The data volume and potential network load should be kept in mind to ensure performance. Ensuring high data quality is also of the utmost importance; completeness, accuracy and the relevance of the data play a central role here. Another crucial element is the choice between real-time data collection or collection in periodic batches, which strongly depends on the specific use case.
Store
Finally, the differently derived data is combined and brought together in a central storage location, such as a data warehouse. The final transfer to the target database then takes place via the data pipeline. It is also important to consider whether the data can be retrieved efficiently or whether the raw data needs to be adapted.
What if the necessary data is missing?
It is not uncommon for data to be missing. This is usually due to a problem with the data itself or technical challenges.
Possible causes and solutions:
- Incorrect extraction
- Check extraction logic and scripts for errors
- Check availability, access authorization and configuration of the data source
- Check data format
- Data is already missing from the data source
- Maintain source system
- Source system has been changed
- Note structural change in data collection
- Check updates
Alternatively, it is possible to supplement missing information through data enrichment. The values can be derived by either including additional data sources, recalculating them or estimating them.
Conclusion
Data integration marks the first decisive step in creating a solid data foundation. It enables data from different sources to be brought together efficiently and paves the way for the following phases: data transformation and visualization. By successfully integrating data, we lay the foundation for a profound understanding and the ability to act in a data-driven manner.
In the next step, we need to address the question of how meaningful information for data visualization can be obtained from the collected data. But more on this in the next article!