What if medical devices were always reliable and available? Intelligent dashboards make this vision tangible. They enable proactive monitoring and maintenance medical devicesbefore failures occur. This means that critical systems always remain operational - exactly when they are needed most.
Why dashboards for device monitoring?
The monitoring of medical devices plays a central role in ensuring safety and efficiency in patient care. Every device fulfills a potentially vital function. But even the most reliable devices can fail unexpectedly or require maintenance. This is where our dashboards come into play: they provide a transparent overview and help to detect failures at an early stage and plan maintenance.
Field Service Map Dashboard
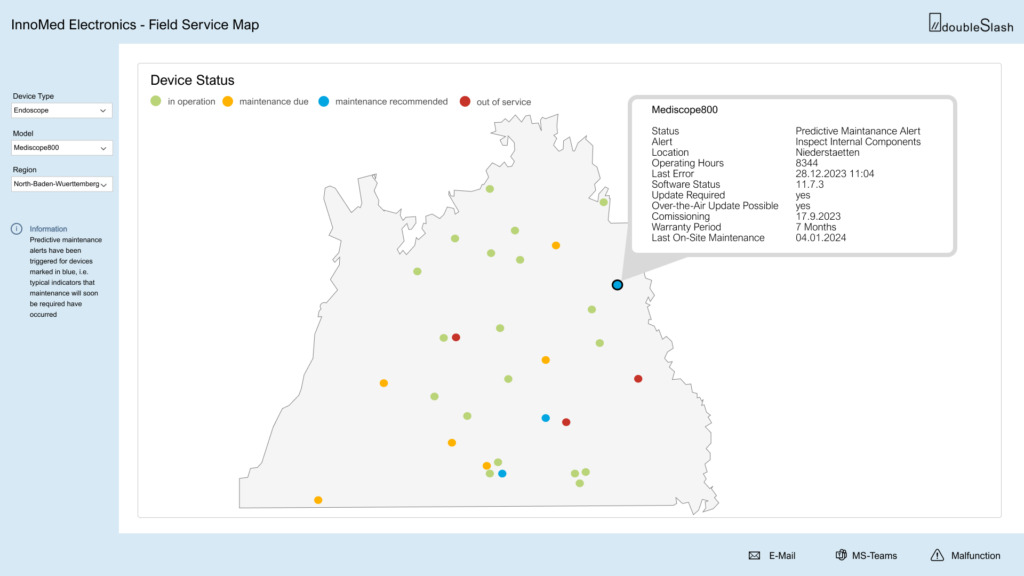
This dashboard is intended to enable device manufacturers and their technicians to gain an overview of all devices and identify potential repair requirements.
The most important elements and functions at a glance:
- Color-coded map
- Overview of the status of all devices
- Signals possible need for action
- Predictive maintenance alert (blue): proactive recommendation of a repair
- Interactive mouseover
- Detailed insight into the condition of individual devices
- Indications for cause of error and action to be taken
- Filter options:
- Filter for device, model and region
- Regional monitoring: simultaneous monitoring of several hospitals possible
- Individual evaluation and targeted filtering for specialized technicians
The colour-coded map allows devices requiring maintenance to be identified as quickly as possible and the available resources to be prioritized. This results in faster localization and rectification of device faults, which helps to minimize the downtime of medical devices. The predictive maintenance alert is triggered for devices that are still functioning and are predicted to require maintenance in the near future. This proactive maintenance measure creates the basis for proactive maintenance planning and prevents potential downtime.
Maintenance Department Dashboard
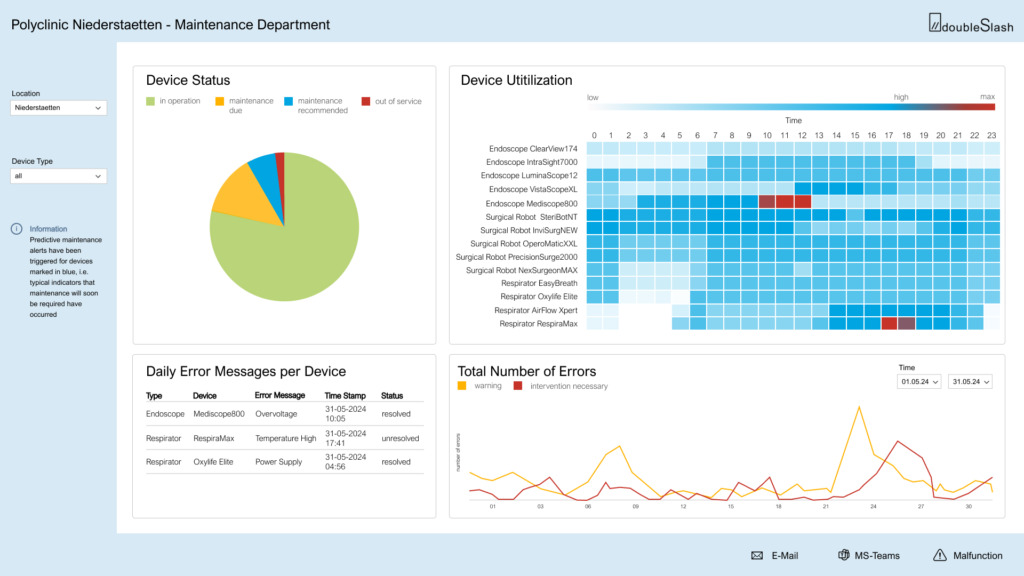
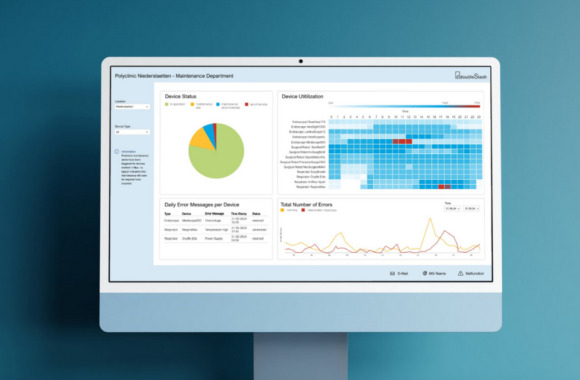
This dashboard provides a hospital's maintenance department with real-time insights to efficiently monitor the status, utilization and maintenance needs of their equipment: The most important elements and functions at a glance:
- Pie chart
- Color coding of the device status of all devices
- Easy reading of the proportion of operating, defective and maintenance-requiring devices
- Heatmap
- Detailed overview of device utilization
- Color indicators show the degree of utilization of the appliances by the hour
- Quick identification of busy devices (dark blue and red)
- Error message table
- Lists all devices with error messages
- Information on the cause, time and status of the error
- Line diagram
- Number of all error messages for a selected time period
- Tracking of warning and intervention messages
- Filter options:
- Filter for device type and location
- Targeted monitoring of the operating status of a device type possible
While the pie chart provides a clear breakdown of the operating status of all devices and thus enables a quick overview of operating, defective and maintenance-requiring devices, the error message table provides a detailed overview of defective devices, which enables a quick response and troubleshooting.
The line diagram provides a comprehensive view of the development of the error message over a selected period of time. By displaying highs and lows, it is possible to track when warnings occurred more frequently and interventions were necessary.
The heat map clearly visualizes the utilization of the devices, which optimizes resource allocation. Peak times can be easily identified and bottlenecks avoided.
Conclusion
The dashboards presented here offer an innovative way of efficiently monitoring medical devices. Through the Intelligent visualization and analysis of data downtimes can be minimized and maintenance can be planned in a targeted manner. The result? Greater efficiency and improved patient care.
* The designations and names in the dashboards are fictitious. Any similarities or similarities are purely coincidental and not intended.
Co-author: Stefan Dürnay