In Grafana Cloud, you can not only display actual values - you can also look into the future. Thanks to the integrated machine learning function "Metric Forecast", Grafana automatically predicts future values. This allows you to detect deviations at an early stage - before they become real problems. (Link to the documentation)
Why forecasts are worthwhile for your monitoring
- Detect anomalies automaticallyas soon as a metric deviates from the expected range, Grafana immediately sounds the alarm.
- Plan aheadTrends and seasonal patterns such as peak loads or weekly cycles are automatically recognized by Grafana.
- Reduce false alarmsThe forecast corridor takes into account natural fluctuations and filters out non-critical outliers.1
Three typical application scenarios in everyday life
- Reliably predict incoming SQS queues and API calls - for time-critical systems such as Zuora callouts, for example.
- Estimate system resources such as CPU, memory or network consumption at an early stage - before bottlenecks occur.
- Analyze business metrics with foresight - such as sales, bookings or conversion rates achieved through your digital offering.
How does forecasting work with Grafana?
Grafana analyzes historical metrics data, recognizes patterns and automatically creates a forecast corridor from itⒾ. The current measured values are continuously compared with this forecast.
You can adjust the prediction corridor specifically, for example using parameters such as Uncertainty Interval WidthⒾ(tolerance range), Trend fashionⒾ (course of the forecast) or the SeasonalityⒾ-settings (recurring patterns). Here you will find all configuration options.2
Grafana also continuously calculates an anomalous signalⒾthat shows deviations from the forecast corridor. You can use this signal directly for alerts, for example via Slack or email.
Advantages over static alarms
- An end to rigid limit valueswhich sound the alarm every time an outlier is detected.
- Your alarms adjust automatically - whether for traffic peaks or changes in usage.
- Works flexibly: for individual events as well as for aggregated metrics.
How to set up forecasts in Grafana
You can find the forecast function in Grafana Cloud under:
AI & Machine Learning → Metric Forecasts → New Forecast
There you select any time series metric - e.g. incoming SQS messages - and Grafana automatically creates a forecast including a forecast corridor.
You can see this in the visualization:
- the blue line for the prediction
- the green line for the actual values (Actual) and
- the blue shaded area as the forecast corridor.
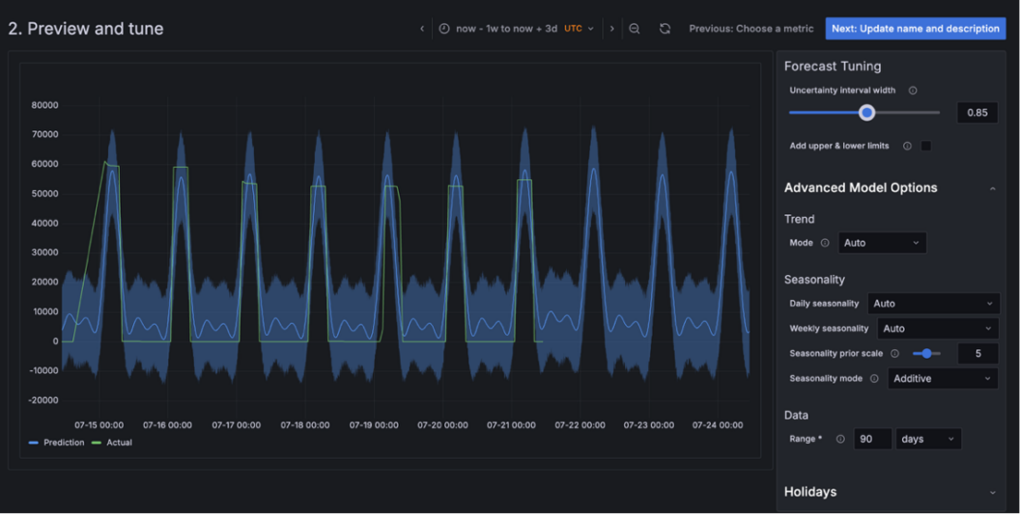
You can adjust the forecast in the panel on the right:
- Uncertainty Interval WidthDefines how wide the forecast range may be.
- Trend fashionDecides whether the trend is recognized automatically or set manually.
- SeasonalityDefines whether daily or weekly patterns are to be taken into account.
This allows the model to be optimally tailored to the behavior of your metric - without manual threshold tuning.3
Detect anomalies - and raise the alarm in a targeted manner
In addition to the forecast, Grafana automatically calculates an anomalous signal. It shows you in real time whether a current measured value is within the expected range or deviates significantly from it.
The signal distinguishes between three states:
0: within the forecast corridor1: above the forecast corridor-1: below of the forecast corridor
You can use this signal directly for alerting. This allows you to react specifically only to critical deviations - for example, with the following condition for a shortfall:
<metric_name>:anomalous() < 0
This way you avoid unnecessary false alarms and concentrate on real outliers.4
Conclusion: Proactive instead of reactive - with forecasts for smart monitoring
With Grafana Metric Forecasts you leave the world of rigid threshold values and no longer only react when things are already on fire. You recognize deviations at an early stagedynamically adjusts your alarms - and avoids unnecessary stress caused by false alarms.
Whether technical metrics or business-critical KPIs: If you know what is "normal", you can monitor everything else specifically and intervene where it really counts.
In short: those who use forecasts are one step ahead.
Explanation of terms
- Forecast corridorThe prediction corridor describes the range around the predicted values within which the actual measured values may naturally move.
- Uncertainty Interval WidthThis value determines the width of the forecast corridor. A larger width means that stronger natural fluctuations in the forecast are accepted.
- Trend fashionThe trend mode determines whether the forecast is based on a constant or dynamic trend.
- SeasonalitySeasonality recognizes recurring patterns in the data, for example daily, weekly or seasonal cycles.
- Anomalous signalThis automatically calculated value indicates when current measured values are outside the expected range.