
In this case too, the project situation comes from an agile project in which the Scrum process model was used. If you are not yet familiar with Scrum and are looking for more information, then take a look at the first two parts of our quiz series. You're sure to find what you're looking for there!
In the first two parts, we dealt with the Sprint Planning and the Sprint backlog busy. Now the sprint is over and it is time to check how successfully we have worked through the sprint backlog. Have we achieved our sprint goal? Were we able to successfully implement all the user stories that we had planned for the sprint?
Let's Quiz
Welcome to the Agile Project Management Quiz - Part 3. Here you can test your Scrum skills and project management knowledge on real project examples. As in the last two parts of our quiz series, this is again about a project situation that we have experienced ourselves and for which we had to find a solution.
In this case too, the project situation comes from an agile project in which the Scrum process model was used. If you are not yet familiar with Scrum and are looking for more information, then take a look at the first two parts of our quiz series. You're sure to find what you're looking for there!
In the first two parts, we dealt with the Sprint Planning and the Sprint backlog busy. Now the sprint is over and it is time to check how successfully we have worked through the sprint backlog. Have we achieved our sprint goal? Were we able to successfully implement all the user stories that we had planned for the sprint?
Reporting - Is our project successful?
Consistently implemented reporting is inevitably linked to the success of a project. Even in agile projects, it is therefore important to Continuously monitor project progress.
Ideally, all user stories are fully processed and implemented by the end of the sprint. In practice, however, the picture is often different and the sprint goal could not be achieved. There are many reasons for this. Information on individual work packages may have been missing, or there may simply have been a lack of personnel capacity in the team to complete all tasks.
In any case, valuable insights can be gained at the end of a sprint about how successful the work was and what needs to be considered in the next sprint planning in order to achieve the sprint goal in the future.
As the Sum of all achieved sprint goals the progress of the project as a whole this information is also ideal for demonstrating and documenting overall progress.
Burndown Chart
Burndown charts are a common tool used in practice to check the progress of projects and/or sprints. If certain framework conditions are met, it is conceivable to use them. You will find out what these conditions are in a moment. First, let's take a closer look at the principle of a burndown chart. How is it structured? What does it say?
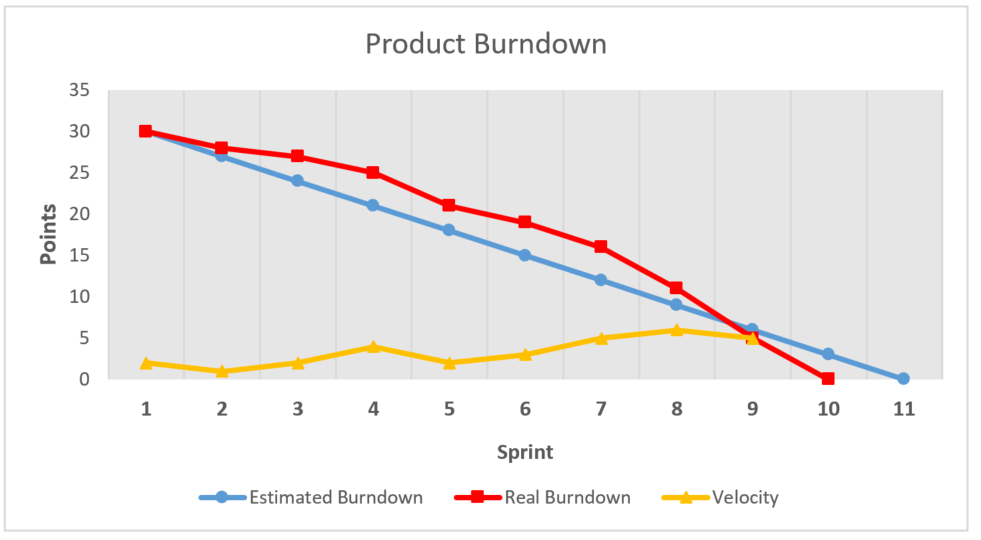
In a Burndown Chart the story points of the individual user stories that still need to be processed are plotted on the y-axis. The x-axis shows the sprints of the project. The number of remaining story points in the backlog decreases with each sprint. Ideally, the curve drops linearly until the end of the project, until at some point there are no more story points and all the work has been "burned".
In the following illustration you can see an example burndown chart for the burndown in the project. Although the progression of the real burndown is not ideal, it is realistic. The reason for this is the fluctuating velocity of the team. The velocity indicates how many story points per sprint were processed by the team. After a familiarization phase, this increases slowly. The red curve (real burndown) decreases correspondingly faster. The estimated burndown (blue curve) shows the predicted state - a linearly decreasing curve that assumes a constant velocity of the team.
Let us now return to the framework conditions mentioned at the beginning. What conditions must be met for a burndown chart to work and be meaningful?
The burndown chart works great when...
- ... the team strength is stable across all sprints
- ... the sprint length remains the same
- ... the product backlog is completely filled, estimated with story points and prioritized at the start of the project.
If these conditions are not met, the complexity also increases. But even then, working with the burndown chart is not impossible.
The chart can also be applied to individual sprints. In this case, the y-axis indicates the story points of a sprint, while the x-axis shows time points within the sprint.
If you combine the two charts, you have two very good tools for easily measuring the progress of a project.
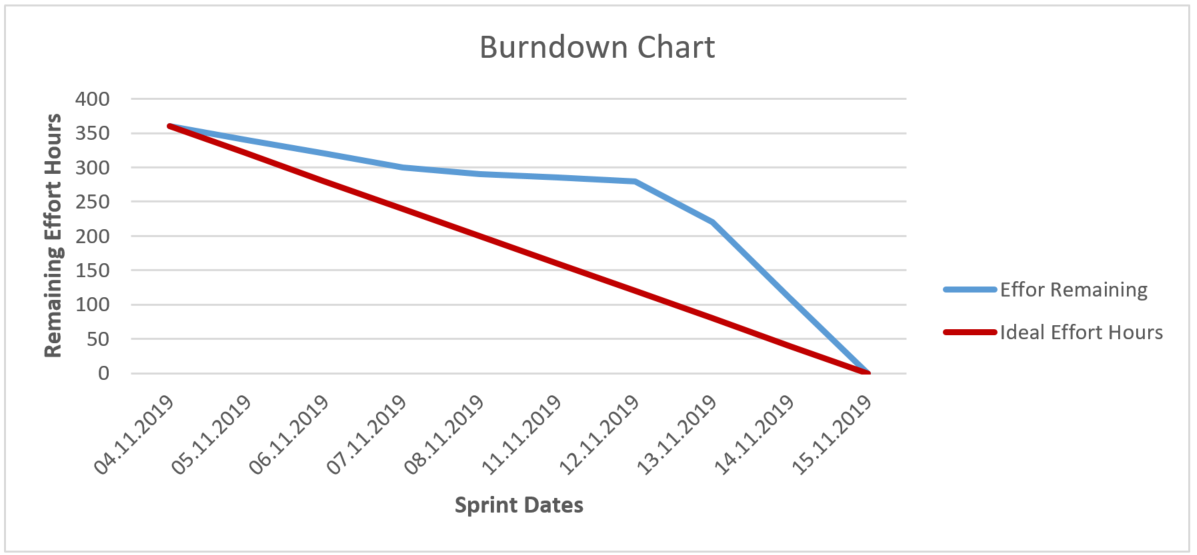
Incidentally, burndown charts can also be used in other projects, as long as you think in terms of milestones instead of sprints and open tasks instead of user stories.
The practical case - a magic triangle
In a specific practical case, the progress of the project was reviewed by the project manager in the last quarter of an agile project as part of the magic triangle.
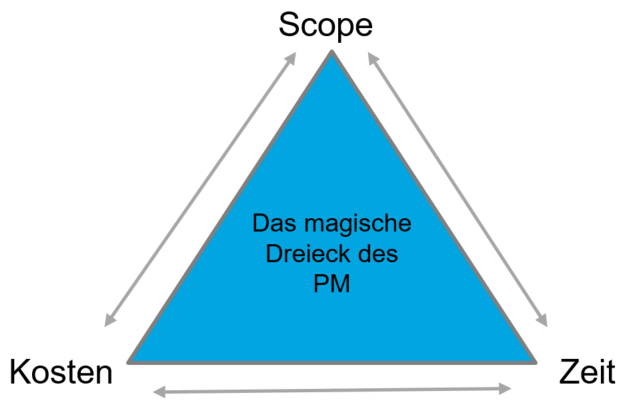
The project manager noted that...
85% of the time has elapsed,
35% of the scope were implemented and
65% of the planned costs have already been used.
Now it's your turn!
Question 1: By what means was the project manager able to determine this?
Question 2: What are the possible causes of this project status?
Question 3: What do you think the project manager should do to improve the situation?
| For this case, too, there is no the right solution. Please send us Your answers per Contact form or post a comment under this post, then we will gladly send you the Sample solution, that is, our recommendation for dealing with the project situation, by mail back. We look forward to your ideas! |
Here you will find parts 1, 2 and 4 of the project management series:
Part 1 of the PM Quiz - Sprint Planning - All beginnings are difficult
Part 2 of the PM Quiz - Sprint Backlog - Let the sprint begin!
Part 4 of the PM Quiz - Sprint Review - What have we achieved?