What is data quality?
Measures are decided and decisions are made on the basis of data. The quality of the data therefore plays a major role. Data quality indicates the "degree of suitability of data to fulfill the purpose for which it was collected or generated" [1]. Data quality therefore indicates the extent to which the available data is suitable as a basis for further planning. Data quality is subjective and depends a lot on feelings and individual assessments, especially in companies [2]. This is mainly because every company, every system and every employee needs different data and has different perceptions of its relevance [3].
Differentiation between technical and functional data quality
At doubleSlash and also in the context of the thesis, a distinction is made between functional and technical data quality. We have defined both as follows:
Technical data quality
- technical factors of the data and the system of their storage
- Base layer (elementary basic components of a data set)
- Zero values in columns or rows
- Format of the data (e.g. XML, JSON, etc.)
- Formatting of individual values (e.g. addresses, dates)
- Adjusting the units (e.g. liters, milliliters)
- Table structures
Technical data quality
- Data content and links
- Conceptual data models
- Definition of parameters, responsibilities, terms and boundaries
- Domain knowledge of employees (distinctive knowledge base in a respective specialist area/project)
Technical data quality is about an attribute being defined in accordance with the rules, i.e. correct syntax. In contrast, functional data quality is about the logical context of the data, i.e. correct semantics [4]. For example, as shown in the following figure, an attribute, in this case "date of birth", can be of good technical quality, while the functional quality is poor:

Data quality criteria
There are various criteria for assessing data and information quality. The following figure shows the 15 most important criteria according to the German Society for Information and Data Quality (DGIQ):
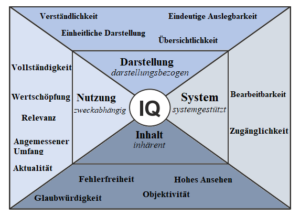
The criteria are divided into four categories, in each of which different aspects must be considered. Overall, data and information quality is determined by all dimensions together, as each dimension is a critical success factor for a functioning overall system. It is therefore not enough for only certain dimensions to be of high quality; each individual dimension must have a high level of quality.
Creation of artifacts for the assessment of data quality
Since data quality is highly relevant, but its assessment is often not so trivial, I have created two artifacts to better assess data quality: a catalog of measures and an associated process model.
To create these artifacts, I conducted interviews with colleagues at doubleSlash who are involved in projects in the E-mobility sector are active. From the interviews, the Problems identified in practice and from this Requirements for the catalog and the process model was defined. It was also found that many companies are aware of the importance of data quality for the success of a project, but often fail to implement it due to its complexity. The concepts and models exist in theory, but are rarely used in practice due to the excessive effort involved. There is no compact procedure for optimizing data quality that can actually be used in projects.
The two artifacts created are intended to offer precisely this compact and clear approach to gradually improve data quality.
Catalog of measures to optimize data quality
The catalog of measures developed contains a total of 21 measures that can be used to optimize data quality. Here is a small excerpt from the catalog:

There is a detailed version of the catalog that contains specific implementation instructions for each measure and a corresponding DIN A4 page that lists all measures in a table and divides them into categories. In addition, there is a note column in this table for each measure, in which it is briefly mentioned which aspects are explained in more detail in the more detailed version. Finally, there is a column indicating which data quality criterion is mainly improved by the implementation of the measure.
Structure of the process model
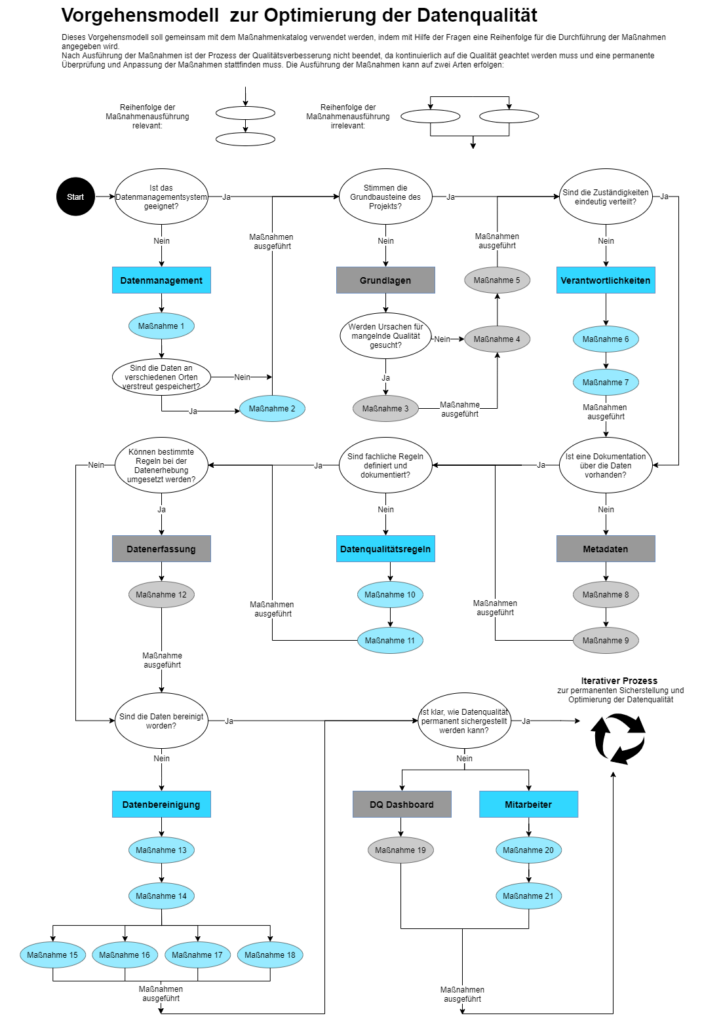
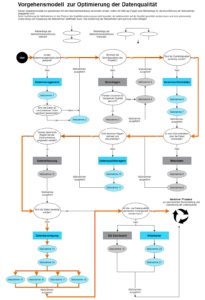
The process model can be used as a guideline for the catalog of measures. It specifies a sequence for the implementation of the measures and uses questions to check whether the implementation of certain measures in a category appears to make sense in the respective application context.
And this is what the process model looks like:
Application in practice
I applied the created artifacts to a sample data set from the automotive industry. To do this, I first used the process model and followed the corresponding path based on the questions. In doing so, I discovered that the organizational factors in this project fit so far, but that data cleansing had not yet taken place. For this reason, measures 13-18 were applied to the data set in order to be able to analyze it better.
In measure 13, for example, the duplicates were removed and in measure 16 the time stamps were brought into a standardized format.
Many companies are aware of the high relevance of good data quality. However, the requirements vary depending on the industry and data set. Optimizing data quality is a multi-complex topic and therefore very time-consuming. Many companies do not have the time to deal with this topic in detail. For this reason, the catalog and the process model are intended to provide added value by offering a time-saving way of finding the right solution for your own company. The use of the process model and the associated implementation of the measures is not a one-off process. To ensure a permanently high level of data quality, all steps must be run through and adapted regularly.
Learn more about software development
Sources
[1] Würthele, Volker (2003): Data quality metrics for information processes. Data quality management by means of holistic measurement of data quality. Dissertation. Swiss Federal Institute of Technology Zurich, Zurich.
[2] Rohweder, Jan P.; Kasten, Gerhard; Malzahn, Dirk; Piro, Andrea; Schmid, Joachim (2021): Information quality - definitions, dimensions and terms. In: Knut Hildebrand, Marcus Gebauer and Michael Mielke (eds.): Data and information quality. Wiesbaden: Springer Fachmedien.
[3] Harrach, Hakim (2010): Risk assessments for data quality. Concept and realization. Wiesbaden: Vieweg + Teubner Verlag | Springer Fachmedien.
[4] Weber, Kristin; Klingenberg, Christiana (2020): Data Governance: The guide for practice. Munich: Carl Hanser Verlag.