
Janina Stifel

Janina Stifel

Janina Stifel completed her Bachelor of Science in Business Informatics at the HTWG in Constance and is currently doing her Master's degree at the Technical University of Munich. She has been working at doubleSlash since 2020, where she supports the Design & Development department. She is particularly interested in business process modeling and the Data processing and visualization.

Contributions from Janina Stifel

close-up-of-the-hand-writing-on-the-pocket-calculator

Data visualization in Confluence: Your guide to appealing diagrams

In our data-driven world, appealing and clear visualizations are more important than ever to make complex information easy to understand. With Confluence, you have numerous options for presenting your data in an impressive way.

Code egg

Hidden treasures: Easter Eggs in the world of data visualization

Easter eggs are more than just hidden surprises in software and games. In this blog post, we explore their history, meaning and how they can be used in data visualization.

Data quality

How can data quality be optimized in practice?

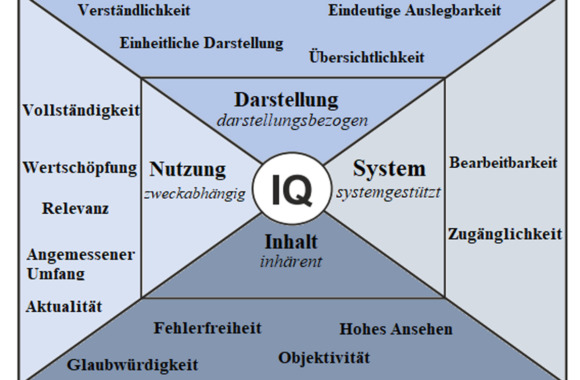
As part of my bachelor's thesis, I dealt extensively with the quality of data and created two artefacts to optimize it: a catalog of measures and an associated process model.

,
Sankey_Diagram_sales_forecast

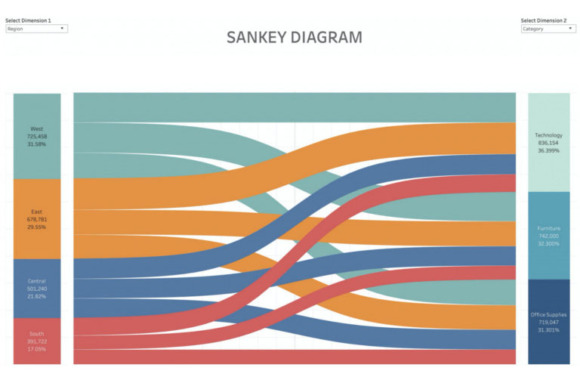
Next Level Flowchart: The Multi-Level Sankey Diagram

What exactly is a Sankey diagram? And how can this representation be expanded? We answer these and other questions in this blog post.

Covid vaccination progress by federal state

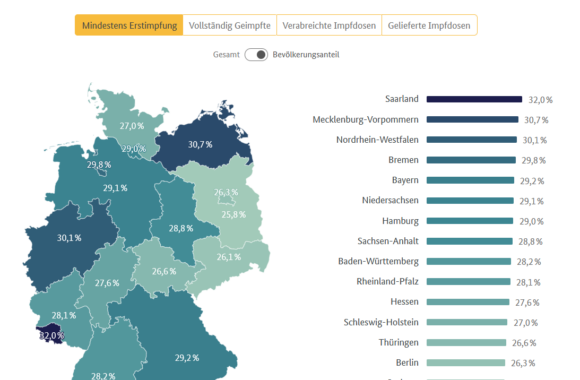
Data visualization in practice: the vaccination dashboard

As part of our Data integration and visualization AG Due to the current corona situation, we have decided to use the vaccdashboard.com a closer look.

Arrow up