What is Self-Service Business Intelligence?
The goal of Self-Service Business Intelligence (BI) is one of Data analysis driven by business users to make this possible. IT departments, which used to play a central role in data provision and transformation, now only provide the required data sources with the corresponding interfaces. Using the self-service BI tool, the business user is then enabled to use the various data sources provided. Combine data sources yourself and transform data as required. The data prepared in this way by the user can then be visualized with the same tool according to the individual questions.
Gartner's Magic Quadrant for Business Intelligence and Analytics Platforms
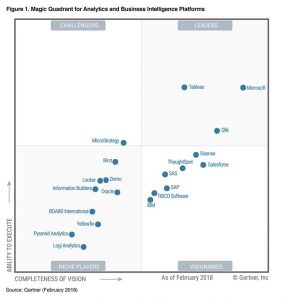
Gartner evaluates BI solutions annually and classifies them in its Magic Quadrant. Since 2016, Gartner has differentiated between the classic analytics toolswhich enable complex, IT-driven reporting, and modern analytics tools - the self-service BI solutions.
Vendors of products that make it into Gartner's Magic Quadrant for Business Intelligence and Analytics Platform must support at least five defined use cases and have 15 self-service BI-specific features.
These include, for example:
- Independent data preparation
- Intelligent, embedded data analysis capabilities
- Interactive and intuitive visualization options for various end devices
- Independent ETL (Extract, Transform, Load) process for diverse, large and heterogeneous data sources
- Cloud BI
- Sharing and collaborative editing of individually created content
For the past two years, two providers have stood out in particular among the leaders in self-service BI tools: Microsoft with its "Power BI" product and the company Tableau with its product of the same name.
The recipe for success of Microsoft Power BI and Tableau
Microsoft Power BI
Microsoft offers the Power BI Suite, consisting of Power BI Desktop and Power BI Servicea data analysis tool that can be used both as an on-premise solution and via the Azure Cloud. Power BI Desktop offers Numerous data integratorsso that the user can obtain the required data from various sources. import yourself and combine as required can. The individual reports and dashboards can then be shared and edited with other users via the Power BI service.
With its pricing structure for the Power BI Suite, Microsoft is putting pressure on the BI tools market. So there is the Basic version of Power BI Desktop, for example, free of charge. License fees are only charged for the Pro version and, according to Gartner, are still well below the industry average. Only the Scaling the amount of data used in combination with MS Azure or HDInsight, fall comparatively short according to Gartner. High costs for the Power BI user to.
Power BI offers a further advantage in the area of data integration. Power BI makes it possible, Connect many different data sources. It does not matter whether data from relational or non-relational databases can be connected with each other. Microsoft Power BI also offers the option of integrating and displaying streaming data in dashboards.
Microsoft naturally also benefits from the entire, own product family and enables a connection not only with Microsoft Cloud technology (Azure) but also with the Machine Learning and Artificial Intelligence Suite (Cortana) as well as Microsoft Flow and Microsoft Dynamics.
In addition to its self-service analysis tool, Microsoft also offers a Strong online communitythe self-service concept of the tool through Application examples, tutorials and blogs underpinned with numerous Q&As.
Tableau
Tableau offers a self-service BI solution with three products: Tableau Desktop, Tableau Server and Tableau Online. Tableau can be used both in the cloud and on-premise. Various data sources can be connected and combined using a variety of connectors with both in-memory access and direct access. With Tableau Desktop, the Data is transformed, visualized and can also be analyzed interactively. Reports and dashboards can be shared with other users and also edited together.
Tableau shines above all in the areas of Data visualization and analysiswhich is also extremely versatile, intuitive and interactive.
In the spirit of a self-service BI tool, Tableau can rely on a Strong and committed community but also has a own customer supportwhich Gartner also highlights as particularly positive.
Tableau also offers great flexibility when it comes to customizing the Tool in the cloud to deploy. This means it can be deployed to the Microsoft Azure Cloud as well as AWS or the Google Cloud Platform.
Practical comparison: Visualization of sensor data with Tableau and Power BI
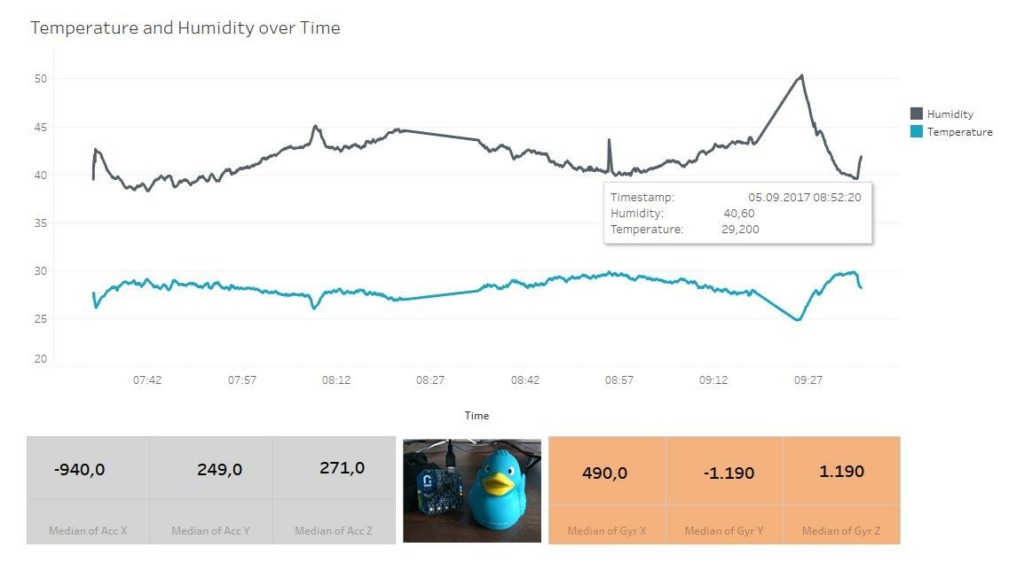
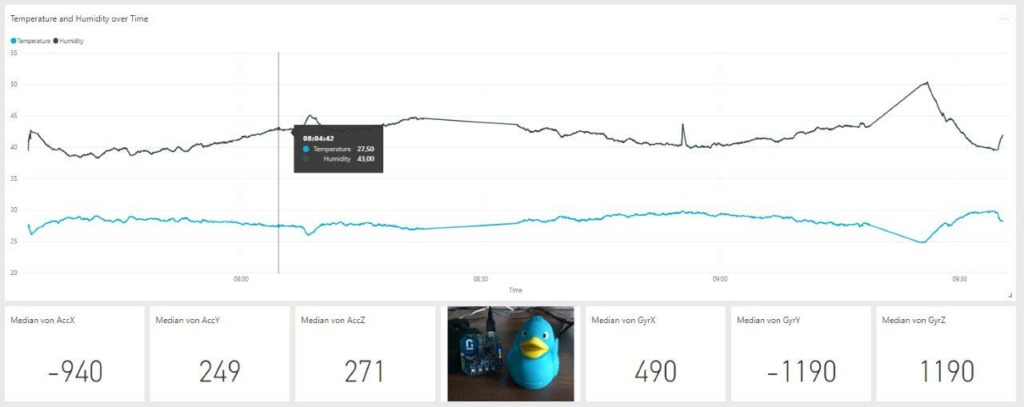
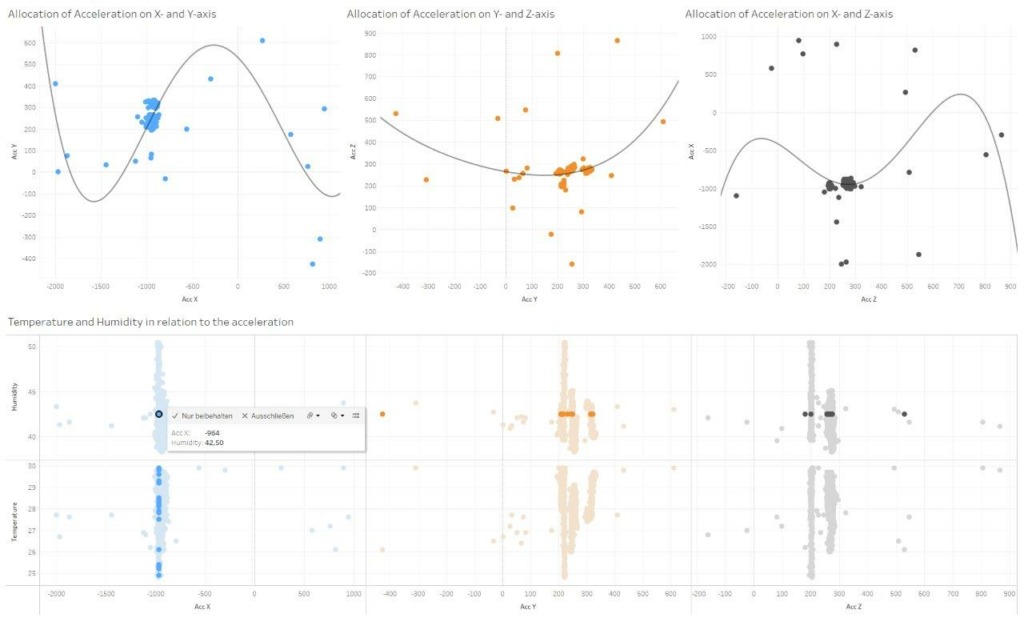
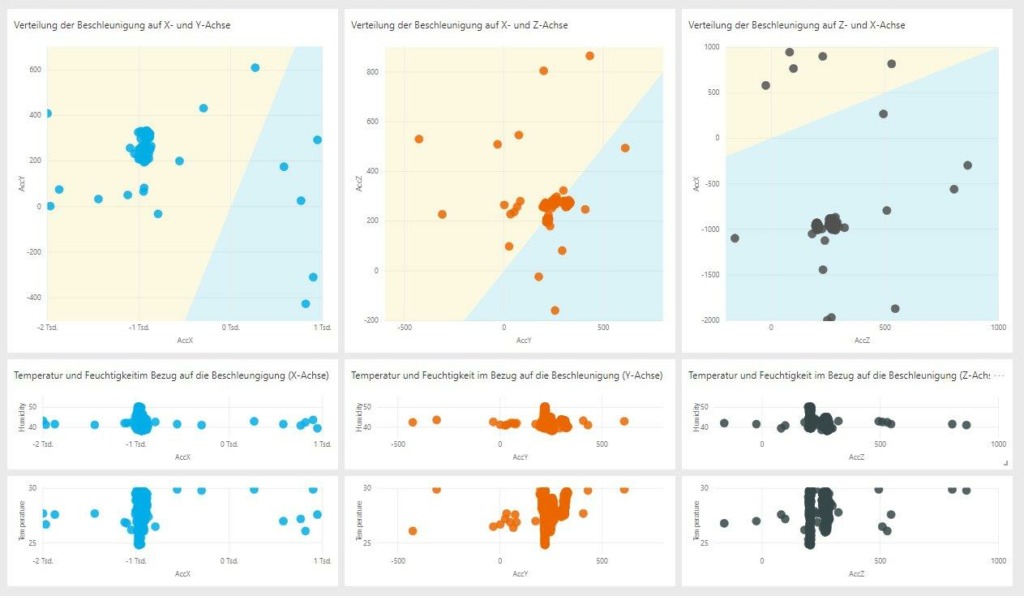
The data set to be visualized comes from a small IoT device that collects data via various sensors. The sensors measure the temperature (Temperature), humidity (Humidity), spatial acceleration (Acceleration on X, Y and Z axes) and the position in space (Gyroscopes on X, Y and Z axes).
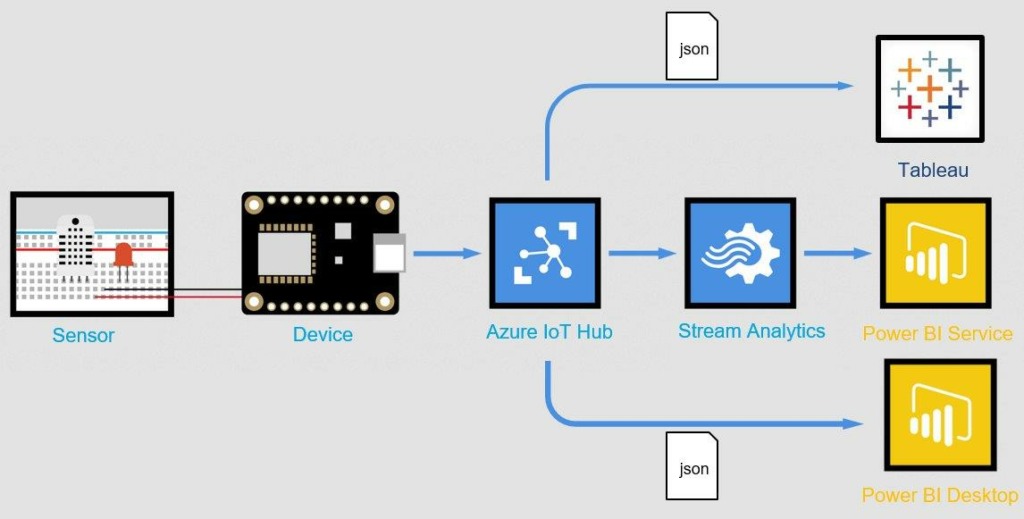
In the present use case, the Azure IoT Hub to collect and store the data and make it available for Power BI and Tableau.
Dashboards Tableau & Power BI
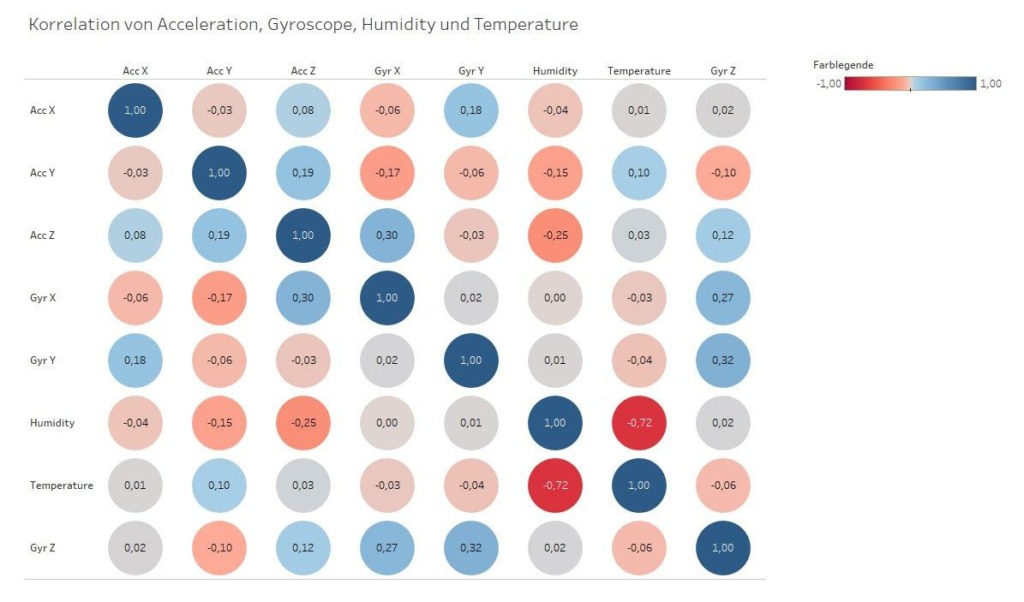
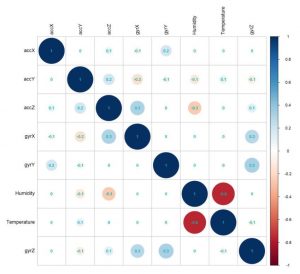
Special feature of Power BI: Dashboard with Stream Analytics
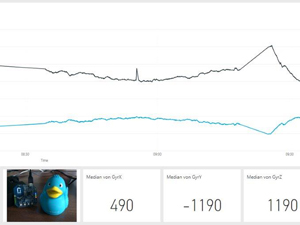
About the Power BI Service offer Microsoft the opportunity to Visualize streaming data with the help of individual tiles on a dashboard. The selection of display variants is currently still expandable. The streaming data can be displayed e.g. by Line/bar or column chartsand Maps or scales (half donut charts see above). Depending on the connectivity and transfer rate of the device, the stream is more or less fluid. The dashboards can then also be Install alertswhich inform the user directly, e.g. by e-mail, when set threshold values are reached.
My summary of Power BI and Tableau
With Tableau, there are virtually no limits to the visualization possibilities.
Tableau offers an extremely wide range of visualization options. All shapes, texts, lines, colors, grouping of data, analysis options within the visualization, etc. can be adapted and thus individually designed. There are (almost) no limits to the imagination here - provided you know that Tableau has such a function and in which menu it can be found. Power BI cannot quite keep up with this variety, even if Power BI does have a large visualization toolbox compared to other tools.

Connecting data sources made easy
Both Tableau and Power BI have a Large repertoire of out-of-the-box solutions for connecting data sources - from simple files and databases to online services and much more. Only a minimal number of these connectors were used in this use case. Nevertheless, it would have been easily possible for both tools to integrate additional data sources such as weather data from a website or a PostgreSQL database.
If you have special types of sources in your own use case (e.g. PDFs, a web analytics application or an ITSM ticket tool), it is worth taking a look at the list of supported sources for both Tableau and Power BI beforehand. Both tools support the most common source formats such as SQL databases, Json or SAP HANA (to name just a few). With the less common sources, however, there are major differences in the available out-of-the-box interfaces.

Possibility of real-time analyses with Power BI
In conjunction with Stream Analytics, Power BI makes it possible not only to tap into static data sources, but also to carry out real-time analyses. Although, or perhaps because, this is a unique selling point of the Power BI Suite, this function can only be used in conjunction with a Power BI Pro license, which is subject to a fee compared to the Light version.
The streaming function is particularly interesting for the Internet of Things sector. For example, machines can be monitored in real time. Alerts can be used to automatically notify the user if limit values are exceeded. Another conceivable area of application would be the smart home. Sensors on the front door, roller shutters, bathtub or the solar power system on the roof can be linked to Power BI via Azure and Stream Analytics and notify residents if a defined limit value is exceeded or not reached.

If you want to share, you have to pay
Both Power BI and Tableau offer various options for sharing the created dashboards. The Tableau and Power BI files can of course always be shared locally, as with any other tool. However, the user must also have access to the associated sources of the file. Access to the files alone is otherwise worthless, as the associated data cannot be displayed. Tableau also offers the option of publishing workbooks and dashboards to the Tableau Server, which can be used to share the content you have created with other users. If you publish your reports from Power BI Desktop to the Power BI Service, a dashboard or the entire report can be shared with other users. However, the sharing function is not included in the free basic scope of Power BI and is therefore subject to a fee, as is the case with Tableau (as license fees are always incurred here).
Sharing and editing created content is easily possible with your tools, regardless of your own use case. The extent to which the resulting costs can best be scaled should be checked individually for your own case.

Conclusion: No master has yet fallen from the sky
In the spirit of self-service BI, the first steps with Tableau and Power BI are quick and relatively easy to master. It only takes a few clicks to import the first data into the tools and create a few dashboards. If you are already familiar with the Microsoft product world, the first steps with Power BI will not be difficult. But even Tableau is intuitive to use after a short time and one or two online tutorials. However, in order to exploit the full potential of the tools, a certain amount of familiarization time is also necessary here, combined with one or two searches in the forums of the active web communities.
If you are introducing Tableau or Power BI for the first time, you should definitely plan a budget for training and a certain familiarization period. The training period is probably shorter with Power BI, as the smaller range of functions and the fact that you are an experienced MS Office user means that you will find your way around more quickly.

Sources:
- Gartner Magic Quadrant Self-Service BI Tool Features: https://www.gartner.com/reviews/market/business-intelligence-analytics-platforms/compare/tableau-vs-microsoft
- Report on the Gartner Magic Quadrant for Self-Service BI and Analytics Platform 2017: https://cdn2.hubspot.net/hubfs/2172371/Q1%202017%20Gartner.pdf?t=149626062
- HDInsight: https://azure.microsoft.com/de-de/services/hdinsight/
- Tableau: https://www.tableau.com/products
- Power BI: https://powerbi.microsoft.com/de-de/what-is-power-bi/
- Self-Service BI: http://triangleinformationmanagement.com/wp-content/uploads/2014/02/Self-Service-Business-Intelligence-empowering-users-to-generate-insights.pdf
- Supported data sources Power BI: https://docs.microsoft.com/de-de/power-bi/desktop-data-sources
- Connectors Tableau: https://www.tableau.com/