The pie chart: visualize data simply and clearly with these three tips
Everyone knows it and probably everyone who has ever visualized data has used it at least once: the pie chart.



Everyone knows it and probably everyone who has ever visualized data has used it at least once: the pie chart.

Even as a small child, I was fascinated by stories. I can still remember the books, stories and characters to this day: for example, Jim Button and Luke the Engine Driver, who are traveling on the island with two mountains with their locomotives Emma and Molly.

Hex Tile Maps are now part of the standard repertoire in the Visualization of data with Tableau.
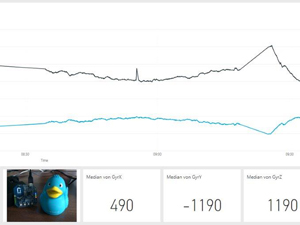
Today, specialist departments need to recognize trends more easily, quickly and flexibly and make decisions based on them. This can provide a decisive competitive advantage. Self-service business intelligence is a good tool for this.

You are currently viewing a placeholder content from Facebook. To access the actual content, click the button below. Please note that doing so will share data with third-party providers.
More InformationYou are currently viewing a placeholder content from Instagram. To access the actual content, click the button below. Please note that doing so will share data with third-party providers.
More InformationYou are currently viewing a placeholder content from Google Maps. To access the actual content, click the button below. Please note that doing so will share data with third-party providers.
More InformationYou are currently viewing a placeholder content from Mapbox. To access the actual content, click the button below. Please note that doing so will share data with third-party providers.
More InformationYou are currently viewing a placeholder content from OpenStreetMap. To access the actual content, click the button below. Please note that doing so will share data with third-party providers.
More InformationYou are currently viewing a placeholder content from X. To access the actual content, click the button below. Please note that doing so will share data with third-party providers.
More Information